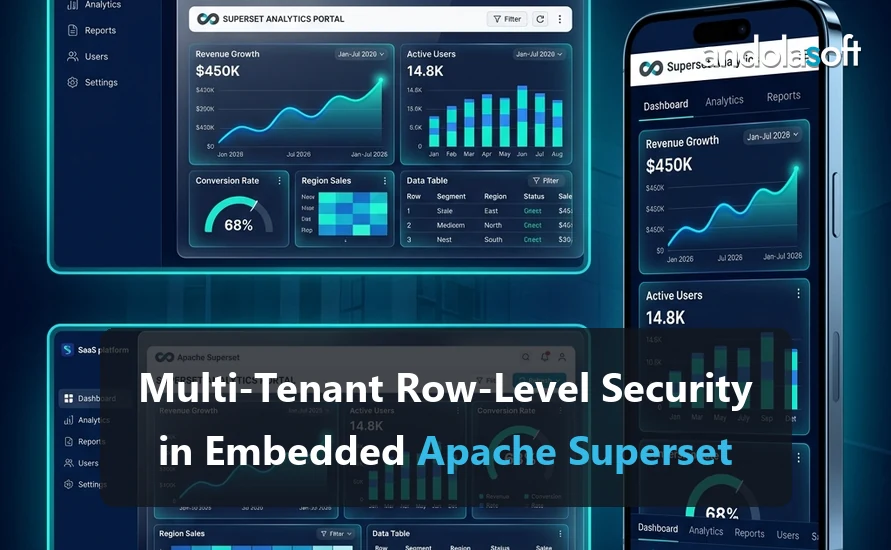
Multi-Tenant Row-Level Security in Embedded Superset: Three Patterns and When Each Fails

Embedding a Superset dashboard in your product is a few hours of work. Making sure that dashboard shows tenant A only tenant A’s rows, for every chart, every filter, every drill-down and every cached result, is the part that decides whether embedded analytics is a feature or an incident.Superset supports three distinct approaches. Teams often pick one because it was the first that worked, without knowing what it does not protect against. This post describes each, shows the configuration, and is specific about where it breaks. It ends with a test plan, because tenant isolation is one of the few things in analytics that you should prove rather than assume.

The setting

A typical embedded setup: your application authenticates its users, then asks Superset for a short-lived guest token scoped to a dashboard. The browser loads the dashboard in an iframe through the Embedded SDK, presenting that token. Superset runs the dashboard’s queries as a guest user with a fixed role and returns the results.

The tenant boundary can be enforced in three places along that path:

  • In the guest token, as RLS clauses your backend attaches when it mints the token.
  • In Superset’s RLS rules, attached to the guest role and parameterised with Jinja from the token’s user attributes.
  • In the data layer, by giving each tenant its own schema or database so that no single query can span tenants.

They are not mutually exclusive. The strongest deployments combine 1 or 2 with 3.

Pattern 1: RLS clauses in the guest token

When your backend requests a guest token, it can include rls clauses. Superset appends each clause to the WHERE of every query the dashboard runs, optionally restricted to one dataset.

json
POST /api/v1/security/guest_token/
{
  "user": { "username": "tenant-acme-user-42", "first_name": "Acme", "last_name": "User" },
  "resources": [{ "type": "dashboard", "id": "c1a4e2d7-...-dashboard-uuid" }],
  "rls": [
    { "dataset": 17, "clause": "tenant_id = 'acme'" },
    { "dataset": 23, "clause": "account_id IN (SELECT id FROM accounts WHERE tenant = 'acme')" }
  ]
}

The clause is SQL. Superset wraps it in parentheses and ANDs it with whatever the chart’s own filters produce.

Why teams like it: all tenant logic lives in your backend, next to the code that already knows who the user is. No Superset configuration per tenant. Adding a tenant is nothing.

Where it fails:

  • You are building SQL from application state. If tenant_id comes from anywhere the user can influence, or is interpolated without care, this is a SQL injection surface inside your security boundary. Derive the tenant identifier from your own authenticated session, never from a request parameter, and use a strict allow-list format (an integer, a UUID) rather than free text.
  • Clauses without a `dataset` apply to every dataset on the dashboard. If one dataset has no tenant_id column, that chart errors. Worse, if a dataset has a column by that name with a different meaning, the filter silently does the wrong thing. Always scope clauses to dataset IDs, and treat a new dataset on the dashboard as a change that needs a matching clause.
  • Virtual datasets. For a dataset defined by a SQL query, the RLS clause is applied to the outer query, not inside the subquery. If the inner SQL pre-aggregates across tenants, the outer filter cannot un-aggregate it. Virtual datasets used in embedded dashboards must keep tenant identifiers at their output grain.
  • Chart-level SQL escape hatches. Custom SQL in ad-hoc metrics or filters still runs inside the same query and is still wrapped by the RLS clause, so this is safe. But SQL Lab and the chart data API used outside the dashboard are not covered by a dashboard-scoped token. Make sure the guest role cannot reach them.
  • Token lifetime. Guest tokens default to a five-minute expiry. A token minted for tenant A and leaked is valid for tenant A’s data for that long. Keep the expiry short and mint tokens on demand, not in advance.

Pattern 2: Superset RLS rules with Jinja

Superset has its own row-level security feature under Settings, Row Level Security. A rule attaches a SQL clause to one or more datasets for one or more roles. The clause can use Jinja, and in an embedded context the interesting variables are the guest user’s attributes:

sql
tenant_id = (
  SELECT tenant_id FROM app_users WHERE username = '{{ current_username() }}'
)

Assign the rule to the guest role (GUEST_ROLE_NAME in superset_config.py), and every query the guest user runs against that dataset is filtered. Your backend puts the tenant-bearing username into the token and does nothing else. Requires ENABLE_TEMPLATE_PROCESSING = True.

Why teams like it: the tenant logic is declared once, in Superset, alongside the datasets it protects. Auditors can read it. A new dashboard on an existing dataset is protected automatically.

Where it fails:

  • The guest role is one role. Every embedded user shares it, so RLS rules cannot distinguish tenants by role. All the discrimination has to come through Jinja and the username, which means the username format is now part of your security model. Document it and validate it when minting tokens.
  • Jinja is a template, not a parameter. current_username() is interpolated into SQL. Superset’s built-in functions are safe, but a rule that interpolates anything user-controlled, such as url_param, is not. Never use url_param or dashboard filter values in an RLS rule; they are user input.
  • Every dataset needs a rule. A dataset added to an embedded dashboard without a rule is fully exposed. There is no default-deny. Put a check in your release process, or a script that lists embedded dashboards’ datasets without RLS rules.
  • Performance. The subquery runs inside every chart query. Index app_users.username, or precompute a mapping table, or the “secure” version of the dashboard is the slow one.
  • The lookup table is inside the analytics database. Your tenant mapping now has to be replicated into the warehouse and kept current. A stale mapping is either an outage or a leak, depending on the direction of the staleness.

Picked a pattern? Now stress-test the failure mode

Each RLS pattern above fails differently at real tenant counts and under caching. A Superset Embedding Feasibility Review pressure-tests your chosen pattern against your actual tenant model before it ships.

Request an Embedding Feasibility Review

Pattern 3: Physical isolation per tenant

Give each tenant its own schema (or database) and point tenant-specific datasets at them. Superset then cannot write a cross-tenant query because no single table contains two tenants.

Two ways to make this work with one set of dashboards:

  • Schema-per-tenant with dataset templating. Superset datasets and SQL templates can use Jinja for the schema name, but the guest token cannot switch schemas on its own. In practice this means one dashboard copy per tenant, generated by script from a template dashboard, each pointing at tenant datasets. The export and import API makes this manageable up to a few hundred tenants.
  • Database-per-tenant with connection-level identity. A separate Superset database connection per tenant, with credentials that can only see that tenant’s data. Combine with the dashboard-per-tenant approach above.

Why teams like it: the boundary is enforced by the database’s own permissions, not by SQL rewriting. A bug in Superset, a missed rule or a bad clause cannot cross it. Compliance conversations are shorter.

Where it fails:

  • Operational load. Hundreds of schemas, database connections and dashboard copies are a real maintenance burden. Dashboard changes must be re-propagated. Metadata database size grows with tenant count.
  • Cross-tenant features are impossible by construction. Benchmarking a tenant against an anonymised peer group, a common premium feature, cannot be done inside the isolated model. You end up building a separate aggregated dataset anyway, with Pattern 1 or 2 protecting it.
  • Provisioning is code you must write and maintain. New tenant means new schema, new connection, new dashboard import, all automated, all tested.

Choosing

Situation Recommendation
Tens to thousands of tenants, shared tables, moderate sensitivity Pattern 1 (token RLS), scoped to dataset IDs, with tenant IDs taken only from the server-side session
Dashboards change often, several teams add datasets Pattern 2 (Superset RLS) for default coverage, plus a release check that every embedded dataset has a rule
Regulated data, contractual isolation requirements, tenant count in the tens Pattern 3 (schema or database per tenant), with Pattern 1 as a second layer
Premium cross-tenant benchmarking Pattern 3 for tenant data, Pattern 1 on a separate pre-aggregated, anonymised dataset

Whichever you choose, apply two rules universally. First, the guest role has the minimum permissions: read on the specific dashboards, nothing on SQL Lab, nothing on the chart or dataset list endpoints. Second, dashboard-level native filters and URL parameters are user experience, never security; a filter can be removed by the user, an RLS clause cannot.

Caching

Superset caches chart data. If two tenants’ queries produce the same cache key, tenant B receives tenant A’s cached rows. Superset includes the query object, which contains the RLS clauses and the guest user context, in the cache key, so the standard patterns above are safe by design. Two things can still go wrong:

  • A custom cache key function or a plugin that builds its own cache key and omits the RLS context.
  • A caching layer outside Superset (a CDN, a reverse proxy cache) in front of the chart data endpoint.

Include a caching test in the plan below rather than reasoning about it.

The test plan

Isolation is testable. Run this before launch and on every change to dashboards, datasets, RLS rules or the token-minting code.

  • Two tenants, known data. Seed tenant A and tenant B with distinctive values you can search for in responses.
  • Positive test. Mint a token for A, load the dashboard, capture every chart data response, assert every row belongs to A.
  • Cross-tenant attempt. Using A’s token, call the chart data endpoint directly with a modified form data payload that removes or alters the tenant filter. Assert the response still contains only A’s rows.
  • Dataset coverage. List every dataset referenced by every embedded dashboard. Assert each has an RLS clause in the token or an RLS rule in Superset.
  • Cache test. Load the dashboard as A, then immediately as B, with identical filters. Assert B’s responses contain none of A’s distinctive values.
  • Expiry. Use an expired token and assert a 401, not stale data.
  • Role scope. Using a guest token, call the SQL Lab, dataset list and chart list APIs. Assert 403 on all of them.

Automate it. A guest token, a couple of HTTP calls and a few assertions fit in any CI pipeline.

Frequently Asked Questions

What is the safest way to isolate tenants in embedded Superset?

Physical isolation, a separate database or schema per tenant, is the strongest guarantee because a mistake in a filter cannot cross a boundary that does not exist. It is also the most expensive to operate. Guest-token RLS clauses are the usual choice for SaaS at scale, and they are safe when the token is minted server-side from the authenticated session and never accepts a tenant id from the browser.

Can one Superset instance safely serve many customers?

Yes, and most embedded deployments do. The conditions are that the tenant identifier comes from your own session rather than from the client, that every dataset in the embedded dashboard carries the isolating clause, and that the test plan below is run on every release. A single dataset without the clause is all it takes for the guarantee to fail.

Does query caching leak data between tenants?

It will if the cache key does not include the tenant. Superset caches on the query and its parameters, so two tenants issuing the same logical query can share a cache entry unless the RLS clause is part of the key. This is the single most commonly missed step in a multi-tenant embed and it does not show up in functional testing.

Do we need a separate database per tenant?

Usually not. A shared database with a tenant column and enforced RLS is adequate for most SaaS products and far cheaper to run. Separate databases earn their cost when a contract, a regulator or a data-residency requirement demands it, or when tenant data volumes differ enough that they need separate tuning.

Build It With Andolasoft

Tenant isolation is one part of an embedded implementation, alongside theming, the token service, SDK integration and event wiring. Our embedded analytics implementation package delivers all of it as a fixed scope, and it starts with a feasibility review in which the tenancy model is the first thing we look at. If your dashboards are already embedded and you want the isolation checked, the Architecture Review covers RLS and role design. The broader controls are in our post on governance and security for Superset deployments.

If you are embedding Superset into a product and want the tenancy model checked before it ships, talk to us. We will review your token service, datasets and cache configuration against the failure modes above, and give you a written plan to close any gaps.
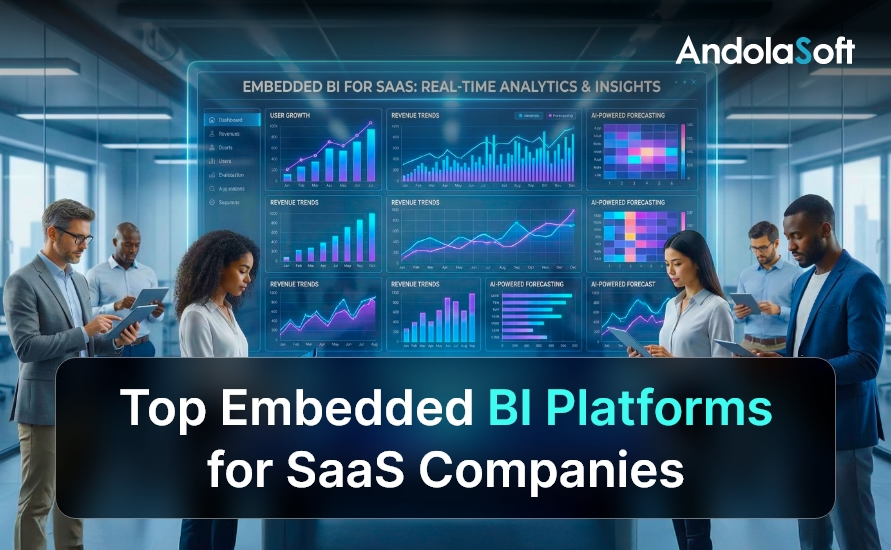
Top Embedded BI Platforms for SaaS Companies

In a crowded SaaS market, integrating analytics into your product is no longer optional—it is essential. That’s where embedded BI platforms come in.

This guide explores the best embedded BI platforms for SaaS companies, how to evaluate them, and how to implement them successfully.
You will walk away with clear insights so your SaaS product becomes more data-driven, sticky, and profitable.

What Are Embedded BI Platforms?

Put simply, BI platforms allow software vendors to integrate business intelligence directly into their applications.

Instead of users leaving the product to analyze data, they get actionable dashboards, visualizations, and analytics without context switching.

These platforms deliver:

  • Real-time analytics inside your app
  • Customizable dashboards
  • Self-service reporting
  • Advanced data modeling
  • Alerts and notifications
  • Role-based access

Embedding analytics transforms standard SaaS features into data-rich experiences. That makes your product more valuable to users and increases retention.

What Embedded BI Platforms Deliver

Why SaaS Companies Need Embedded BI Platforms

Before we review the best embedded BI platforms, let’s cover why they matter for SaaS companies:

  • Retention and Stickiness: When users rely on analytics inside your app, they stay longer.
  • Upsell Opportunities: Premium analytics features can drive higher-tier subscriptions.
  • Better Decision-Making: Users make faster, smarter decisions with insights at their fingertips.
  • Competitive Differentiation: Products with integrated analytics outperform competitors.
  • Reduced Churn: Analytics help users see value faster, lowering churn.

Embedding analytics isn’t just a feature — it is a strategic advantage.

Criteria to Evaluate Embedded BI Platforms

Before choosing among BI platforms, assess them on:

  • Integration complexity
  • Scalability
  • Custom branding
  • API and SDK support
  • Security and compliance
  • Performance
  • Pricing model

Use the following evaluation checklist:

Checklist for Choosing Embedded BI Platforms

  • Offers white-labeling
  • Supports multi-tenant SaaS
  • Provides REST APIs
  • Handles high query loads
  • Role-based security
  • GDPR and SOC 2 compliance

This checklist ensures you choose the right BI platforms for your growth goals.

Top Embedded BI Platforms for SaaS Companies

Here are the best BI platforms that SaaS companies should consider. Each one is evaluated for scalability, ease of integration, and value for SaaS products.

1. Tableau Embedded Analytics

Tableau is a leader among embedded BI platforms with enterprise-grade analytics and robust visualization tools.

Pros:

  • Advanced visuals
  • Strong community and support
  • Scales for enterprise users

Cons:

  • Higher cost
  • Requires more development effort

Best for: Large SaaS companies with complex analytics needs.

2. Power BI Embedded

Microsoft’s Power BI Embedded makes Tableau-level analytics accessible at a lower entry cost.

Benefits:

  • Microsoft ecosystem integration
  • Real-time dashboards
  • Affordable pricing tiers

Considerations:

  • Less flexible than some specialized products
  • Licensing can be complex

Ideal for: SaaS companies using Azure and Microsoft tools.

3. Looker Embedded Analytics

Looker’s architecture makes it one of the most modern BI platforms available.

Highlights:

  • Centralized data modeling
  • SQL-based transformations
  • Strong API support

Challenges:

  • Learning curve for LookML
  • Pricing tailored to enterprise customers

Perfect for: Data-centric SaaS applications and analytics-minded teams.

4. Sisense for Cloud Data Teams

Sisense offers powerful embedded analytics with flexible APIs and cloud-native performance.

Key Features:

  • Elastic analytics engine
  • Fully customizable UI
  • Multi-tenant SaaS support

Points to Note:

  • Teams need technical resources
  • Pricing can scale with usage

Best fit: SaaS products requiring deep integration and customization.

5. Chartio (Now Part of Atlassian)

Although Chartio was acquired, its embedded analytics capabilities continue to influence current embedded BI platforms.

Pros:

  • Simple interface
  • Drag-and-drop analytics
  • Fast onboarding

Limitations:

  • Feature set not as deep as others
  • Transitioning under new brand

Great for: Early-stage SaaS products with basic analytics needs.

6. Metabase Embedded

Metabase is an open-source option among embedded BI platforms, ideal for budget-conscious teams.

Advantages:

  • Open-source flexibility
  • Quick deployment
  • Community support

Drawbacks:

  • Limited enterprise features
  • Requires self-management

Best choice: Small to mid-size SaaS companies.

7. Qlik Sense Embedded

Qlik Sense combines strong analytics with associative data indexing — great for complex data needs.

Benefits:

  • Smart visual associations
  • High performance
  • Strong security

Considerations:

  • Higher learning curve
  • Pricing suited for large organizations

Best for: Data-intensive SaaS platforms.

Embedded Analytics Use Cases by Industry

Understanding real use cases clarifies how embedded BI platforms deliver value in specific scenarios.

SaaS Analytics Use Cases

  • Customer Success Dashboards
  • Product Usage Insights
  • Financial Performance Metrics
  • Operational Reports
  • Executive Scorecards

Bullet points make complex benefits tangible:

  • Track customer adoption trends
  • Surface churn risk indicators
  • Deliver revenue forecasting
  • Enable self-service analytics

These use cases ensure embedded analytics adds measurable business outcomes.

Implementation Best Practices

Implementing BI platforms without a clear plan often leads to delays. Follow these steps for success:

Step-by-Step Strategy

Define Business Goals

  • What decisions will analytics drive?
  • Who are the users?

Prepare Your Data Infrastructure

Select Your Embedded BI Platform

  • Use the evaluation checklist above
  • Build proof of concept

Design Dashboards for Users

  • Keep it simple
  • Prioritize actionable insights

Measure Adoption

  • Track usage metrics
  • Iterate on feedback

Implementing embedded analytics is a project — not just a purchase.

Common Mistakes When Choosing BI Platforms

Avoid these pitfalls:

  • Choosing based on cost alone
  • Ignoring future scalability
  • Skipping user experience design
  • Underestimating data governance needs

By avoiding these mistakes, SaaS companies maximize ROI from embedded analytics.

Pricing Models for Embedded BI Platforms

Understanding pricing helps SaaS teams budget appropriately.

Common Models:

  • Per-user pricing
  • Usage-based pricing
  • API call pricing

Example bullet list:

  • Flat licensing fee
  • Tiered feature pricing
  • Consumption-based billing

Always request transparent pricing before committing.

How to Measure Success

Quantifiable success metrics help justify investment in BI platforms:

Measure these regularly to optimize value.

Integrating Embedded BI Platforms with SaaS Products

Integration approaches vary by platform:

Native SDK Integration

  • Deep customization
  • White-label analytics

iFrame Embedding

  • Fast to deploy
  • Limited customization

API-Driven Integration

  • API first
  • High control

Choose based on technical resources and product roadmap.

Conclusion

Choosing the right BI platforms can transform your SaaS product from a tool into a strategic asset. Embedded analytics drives retention, boosts revenue, and makes your product indispensable.

Evaluate these platforms based on your current needs and future goals, and implement them with a clear roadmap.

If you want growth, better user engagement, and data-driven value, embedded analytics is not optional — it is foundational.

FAQs

1. What are embedded BI platforms?

BI platforms are analytics solutions that allow SaaS companies to integrate dashboards, reports, and visual analytics directly into their applications, enabling users to access insights without leaving the product.

2. How do embedded BI platforms differ from traditional BI tools?

Traditional BI tools operate as standalone systems, whereas embedded BI platforms are integrated within SaaS products, offering contextual, in-app analytics tailored to end users.

3. Why are embedded BI platforms important for SaaS companies?

BI platforms improve product stickiness, reduce churn, enable data-driven decision-making, and create opportunities to monetize analytics as premium features.

4. Can small or early-stage SaaS companies use embedded BI platforms?

Yes. Many BI platforms offer flexible pricing, open-source options, or scalable architectures that suit startups and growing SaaS businesses.

5. What features should SaaS companies look for in embedded BI platforms?

Key features include multi-tenant support, white-labeling, API and SDK access, role-based security, scalability, performance optimization, and compliance capabilities.

6. Are embedded BI platforms secure for customer data?

Most enterprise-grade BI platforms provide strong security features such as role-based access control, encryption, audit logs, and compliance with standards like GDPR and SOC 2.

7. How long does it take to implement embedded BI platforms?

Implementation timelines vary based on complexity, data readiness, and customization needs, ranging from a few weeks to several months.

8. Can embedded BI platforms support multi-tenant SaaS architectures?

Yes. Leading BI platforms are designed to support multi-tenant environments, ensuring data isolation and secure analytics for each customer.

9. How do SaaS companies monetize embedded analytics?

SaaS companies monetize BI platforms through premium analytics tiers, add-on reporting modules, usage-based pricing, or enterprise analytics packages.

10. What are common mistakes when choosing embedded BI platforms?

Common mistakes include focusing only on cost, ignoring scalability, underestimating integration effort, neglecting user experience, and overlooking long-term data governance needs.

Must-Have Enterprise BI Features for Modern Applications

Enterprise software no longer competes on features alone. It competes on how fast decisions are made, how accurately performance is measured, and how quickly leaders can respond to change. That is exactly why enterprise BI has moved from a “nice-to-have” analytics layer to a core operating system for decision-making.

Today, every serious enterprise application — whether it is ERP, CRM, HRMS, FSM, construction management, or financial systems — must embed or integrate BI at its core.

However, not all analytics are created equal.

True enterprise BI is not about pretty dashboards. Instead, it is about governance, scale, trust, performance, security, and decision velocity. Therefore, choosing the right BI features is a strategic architecture decision, not a UI decision.

In this definitive guide, you will learn:

  • What enterprise BI really means in modern enterprises
  • Why basic reporting tools fail at scale
  • The must-have BI features for any serious enterprise application
  • How BI drives adoption, ROI, and competitive advantage
  • How to evaluate an BI platform properly

Let us begin with the fundamentals.

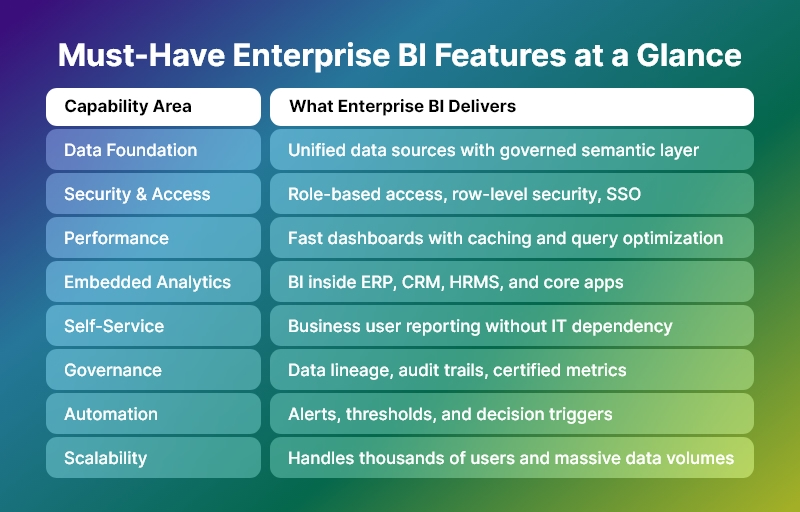
Must-Have-Enterprise-BI-Features-at-a-Glance

What Is Enterprise BI?

It (Enterprise Business Intelligence) is a scalable, governed, secure, and performance-driven analytics layer that supports decision-making across the entire organization—from frontline teams to executive leadership.

Unlike basic BI tools, enterprise BI:

  • Serves hundreds or thousands of users
  • Handles millions or billions of rows of data
  • Enforces data governance and security
  • Supports mission-critical business workflows
  • Integrates deeply into core enterprise applications

In other words, BI is not a reporting tool. It is a decision infrastructure.

Why Basic BI Fails in Enterprise Environments

Many organizations start with simple dashboards. However, they quickly hit limitations.

Basic BI fails because:

  • It cannot scale to large data volumes
  • It breaks under concurrent user load
  • It lacks role-based security and governance
  • It creates multiple versions of truth
  • It depends heavily on analysts instead of business users
  • It does not integrate deeply into enterprise workflows

As a result, enterprises either:

  • Lose trust in data
  • Slow down decision-making
  • Or build expensive, fragmented analytics stacks

This is exactly why enterprise BI exists.

The Strategic Role of Enterprise BI in Enterprise Applications

Modern enterprise applications are no longer transactional systems only. They are decision platforms.

Therefore, BI must:

  • Power daily operational decisions
  • Support strategic leadership decisions
  • Enable cross-department visibility
  • Drive process optimization
  • Enforce data accountability
  • Accelerate business execution

Consequently, BI becomes a core competitive advantage.

Must-Have Enterprise BI Features (Complete Enterprise Checklist)

Below is the definitive feature framework for evaluating or building a true BI system.

1. Enterprise-Grade Data Architecture

BI must handle complexity at scale.

It must support:

  • Multiple data sources (ERP, CRM, HRMS, IoT, Finance, Ops, external data)
  • Structured and semi-structured data
  • Large volumes and high refresh rates
  • Historical and real-time data together

Core capabilities include:

  • Data connectors and ingestion pipelines
  • Data modeling and semantic layers
  • Incremental refresh and caching
  • Support for cloud, on-prem, and hybrid data

Without this foundation, enterprise BI collapses under growth.

2. Single Source of Truth (Semantic Layer)

One of the biggest reasons BI fails is metric chaos.

Therefore, enterprise BI must provide:

  • Centralized metric definitions
  • Business-friendly semantic models
  • Reusable KPIs across dashboards and apps
  • Governance over calculations and logic

Benefits:

  • No conflicting numbers
  • No department-level data politics
  • No spreadsheet shadow systems
  • High trust in executive reporting

In short, BI must enforce truth at scale.

3. Enterprise Security and Access Control

Enterprise BI is useless if it is not secure.

It must support:

  • Role-based access control (RBAC)
  • Row-level and column-level security
  • SSO and enterprise authentication (SAML, OAuth, LDAP, etc.)
  • Audit logs and access tracking
  • Data masking for sensitive fields

Why this matters:

  • Finance, HR, and leadership data must not leak
  • Compliance requirements demand strict controls
  • Large organizations cannot rely on manual permissions

Therefore, security is not optional in BI. It is foundational.

4. Performance at Scale

Enterprise BI must stay fast even when:

  • Data grows 10x
  • Users grow 50x
  • Queries become complex
  • Dashboards become heavier

Critical performance features include:

  • Intelligent caching
  • Query optimization
  • In-memory acceleration
  • Pre-aggregations
  • Load balancing
  • Asynchronous query execution

Because in enterprises:

If dashboards are slow, decisions are slow. And slow decisions cost money.

5. Embedded Analytics for Enterprise Applications

Modern enterprise BI must not live in a separate portal.

Instead, it must:

  • Embed inside ERP, CRM, HRMS, FSM, or industry apps
  • Respect application user permissions
  • Adapt to application workflows
  • Feel like a native feature

Embedded BI enables:

  • Contextual decision-making
  • Higher adoption
  • Better user experience
  • Stronger product differentiation

Today, enterprise BI is a product feature, not a separate product.

6. Self-Service Analytics for Business Users

BI cannot depend entirely on analysts.

It must empower:

  • Managers
  • Operations leaders
  • Finance teams
  • Sales leaders
  • Department heads

Self-service features include:

  • Drag-and-drop reports
  • Filter and slice-and-dice
  • Drill-down and drill-through
  • Custom views and saved dashboards
  • Ad-hoc exploration without SQL

This ensures:

  • Faster answers
  • Less dependency on data teams
  • Higher data culture maturity

7. Advanced Dashboarding and Visualization

Enterprise BI dashboards must support:

  • Executive-level KPI views
  • Operational performance views
  • Departmental scorecards
  • Process monitoring screens

Core visualization capabilities:

  • Interactive charts and tables
  • Cross-filtering
  • Drill-down hierarchies
  • Conditional formatting
  • Alerts and thresholds
  • Storytelling views

However, remember:

Enterprise BI is not about visuals. It is about decisions enabled by visuals.

8. Real-Time and Near Real-Time Analytics

Many enterprise use cases require:

  • Live operations monitoring
  • SLA tracking
  • Incident detection
  • Financial risk control
  • Supply chain visibility

Therefore, BI should support:

  • Streaming or near-real-time data
  • Incremental refresh
  • Low-latency dashboards
  • Operational alerting

This transforms enterprise BI from reporting to control systems.

9. Alerts, Automation, and Decision Triggers

Modern BI must not wait for users to open dashboards.

It must:

  • Push alerts when thresholds are crossed
  • Trigger workflows
  • Send notifications to email, Slack, Teams, etc.
  • Integrate with business processes

Examples:

  • Alert when cash flow drops below limit
  • Alert when project cost overruns
  • Alert when churn risk spikes
  • When compliance metrics fail

This is how enterprise BI becomes proactive instead of reactive.

10. Data Governance and Lineage

At enterprise scale, governance is non-negotiable.

  • BI must provide:
  • Data lineage tracking
  • Impact analysis
  • Change management
  • Certification of datasets
  • Ownership and stewardship models

This ensures:

  • Audit readiness
  • Compliance confidence
  • Trust in enterprise-wide metrics
  • Controlled evolution of analytics

11. Collaboration and Sharing

Enterprise BI is a team sport.

It must support:

  • Shared dashboards
  • Commenting and annotations
  • Versioning
  • Scheduled reports
  • Role-based sharing

This transforms analytics into organizational conversation, not isolated analysis.

12. AI and Advanced Analytics (Optional but Strategic)

Modern enterprise BI increasingly includes:

  • Forecasting
  • Anomaly detection
  • Trend analysis
  • What-if simulations
  • Natural language queries

While not mandatory for every enterprise today, this is rapidly becoming a strategic differentiator.

13. Scalability and Future-Proof Architecture

Enterprise BI must scale across:

  • Users
  • Data volume
  • Use cases
  • Departments
  • Geographies

Therefore, it must support:

  • Modular architecture
  • API-first integration
  • Cloud and hybrid deployment
  • Horizontal scaling
  • Multi-tenant or multi-org setups

How Enterprise BI Drives Real Business Outcomes

When implemented correctly, BI delivers:

  • Faster decision cycles
  • Higher operational efficiency
  • Lower reporting overhead
  • Better leadership visibility
  • Stronger governance
  • Higher ROI from enterprise systems

In short:

BI turns data into organizational leverage.

How to Evaluate an Enterprise BI Platform

Use this checklist:

  • Does it scale to thousands of users?
  • Does it enforce governance and security?
  • Does it embed inside your application?
  • Does it support self-service safely?
  • Does it perform under heavy load?
  • Does it integrate with your data stack?
  • Does it reduce dependency on analysts?

If the answer is “no” to several of these, it is not true BI.

Final Thoughts: Enterprise BI Is Not Optional Anymore

In 2026 and beyond, BI is not an add-on.

It is:

  • A core layer of enterprise architecture
  • A strategic decision platform
  • A competitive advantage
  • A governance system
  • A performance engine

Organizations that treat BI as a strategic system will out-execute, out-learn, and out-scale those that do not.

And that is the real power of BI.

Top 10 Power BI Alternatives with Better Customization

BIIn an era when the demand for data-driven decision-making is skyrocketing, businesses are increasingly seeking more flexible and customizable analytics platforms than traditional tools. According to market data, the global business intelligence market is projected to nearly double from ~ $34.8 billion in 2025 to over $63 billion by 2032, as companies across industries ramp up investments in data and analytics. For many organizations, however, Microsoft Power BI — while popular — can feel limiting in terms of deep customization, embedded analytics, or integration flexibility. That is why exploring Power BI alternatives has become a critical step for CTOs, product managers, and business leaders.

In this blog, you’ll discover the top 10 Power BI alternatives that deliver superior customization, scalability, and control. Moreover, you’ll learn how a seasoned development partner like Andolasoft can help integrate and extend these tools to build truly tailored BI/analytics solutions for your enterprise needs.

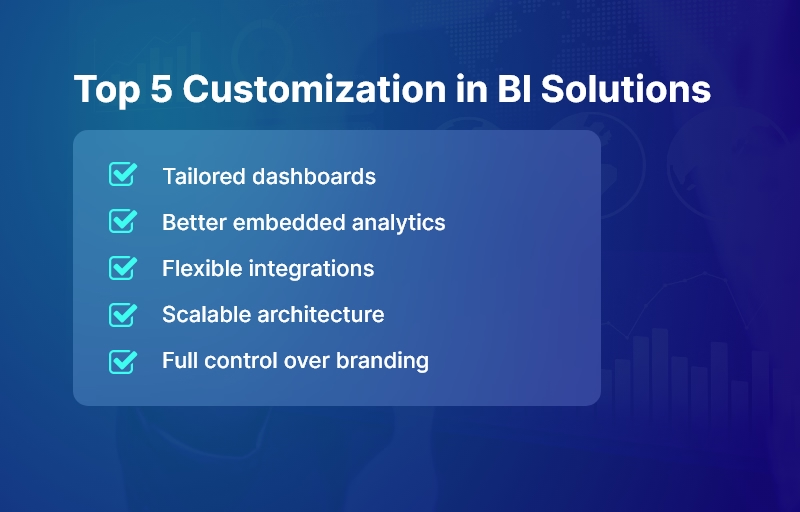
Top 5 Customization in BI Solutions

Why Customizable BI Tools Matter for Growing Businesses

Business intelligence (BI) is no longer a “nice-to-have” — it’s a strategic imperative. As defined by industry experts, BI encompasses the processes and platforms organizations use to collect, analyze, and interpret data to inform decisions.

For growing businesses — whether in healthcare, logistics, eCommerce, education, fintech, or manufacturing — the benefits of BI are tangible: improved operational efficiency, better forecasting, data-driven decision-making, and competitive advantage.

Challenges with Traditional or Out-of-the-Box BI Solutions

  • Many organizations still suffer from low BI maturity: according to a report, over 87% of companies fall into “basic” or “opportunistic” BI maturity levels — relying heavily on spreadsheets or siloed data efforts.
  • Off-the-shelf BI tools may lack the flexibility or extensibility required to adapt to unique business logic, complex workflows, or custom integrations — especially in industries with specialized needs (e.g. multi-warehouse supply chain analytics, real-time IoT data from manufacturing, or compliance-heavy fintech).
  • Without strategic BI implementation, companies risk inefficiencies, poor data governance, security vulnerabilities, and lost revenue opportunities due to underutilized data.

Hence, modern enterprises need customizable, scalable, and secure BI platforms — not patchwork solutions or “quick fix” dashboards.

That’s where exploring Power BI alternatives makes sense — and why partnering with a full-stack development and BI services provider like Andolasoft becomes strategic.

What Makes a Good Alternative? Key Criteria & Best Practices

Before diving into specific tools, it’s useful to understand the criteria and best practices that define a successful BI platform — especially one that seeks to go beyond Power BI’s standard capabilities.

Essential Capabilities to Look For

  • Customizable analytics & dashboards: The ability to build deeply customized reports, dashboards, and visualizations tailored to your domain and metrics.
  • Self-service BI for business users: Non-technical users should be able to explore data, build ad hoc reports, and access insights without deep coding or IT dependence.
  • Scalable, modern architecture: Cloud-native or hybrid platforms that scale with data volume, user load, and complex workflows, with robust governance and security.
  • Integration and flexibility: Ability to integrate with existing data warehouses, data lakes, ETL tools, third-party services, APIs, and custom applications.
  • Embedded & composable analytics: Options to embed BI/analytics within your own web or mobile applications — giving you full control over UI/UX, workflow, permissions, and branding.

Best Practices & Implementation Tips

  • Define your data & analytics strategy first. Establish goals, KPIs, data sources, governance, and ownership before selecting tools — so the BI platform helps solve concrete problems, not just add dashboards.
  • Adopt a modular architecture (data warehouse → analytics engine → presentation layer). This ensures flexibility and future-proofing as data volume and complexity grow.
  • Enable self-service while maintaining governance. Balance user autonomy with data quality, security, and consistent data definitions across the organization.
  • Iterate dashboards & data models over time. Don’t treat BI as a one-time project. Evolve dashboards based on user feedback, changing business requirements, and data volume growth. (Recent research shows that dashboards become more useful when continuously refined.)
  • Use automation, DevOps, and CI/CD for BI pipelines. Treat data pipelines, ETL jobs, models, and dashboard deployments as first-class software — so updates, scaling, and maintenance are systematic and manageable.
  • Ensure scalability and security from day one. As data grows, make sure performance, access control, and compliance remain robust.

Because of these requirements, many businesses find that integrating or customizing a BI tool — rather than using default configurations — yields far higher value. That’s exactly where a partner like Andolasoft brings value, combining expertise in BI, data analytics, SaaS engineering, DevOps, cloud infrastructure, and custom application development.

Top 10 Power BI Alternatives with Better Customization

Here are ten BI tools and platforms that often outshine Power BI when it comes to customization, flexibility, and integration potential. Each of these can be tailored — or embedded — to align with your unique business requirements.

Fully Custom-Built BI Solution by Andolasoft

Sometimes, no standard BI tool fits unique workflows — especially in domains like:

  • Fintech (compliance-heavy custom dashboards)
  • Multi-warehouse logistics (real-time IoT + GIS data)
  • Healthcare (HIPAA-compliant insights)
  • EdTech (student lifecycle analytics)

A full-custom BI solution provides:

  • Controlled data pipelines + governance
  • Tailored dashboards matching exact roles + KPIs
  • Data models specific to business workflows
  • Embedded analytics inside core products
  • Own the full IP + no vendor lock-in

Andolasoft builds these using:

  • Data warehouses (Snowflake, BigQuery, Redshift, etc.)
  • Custom visual layers (React, Angular, mobile apps)
  • Secure pipelines (Airflow, dbt, serverless ETL)
  • AI/ML insights on top of structured metrics

Best suited for:

  • Product-led companies wanting complete control
  • High-growth enterprises needing future-proof scalability
  • Industry-specific use cases NOT supported by generic BI

Google Cloud Looker

Looker is a modern BI platform built around LookML, a semantic modeling layer that ensures consistent business metrics across dashboards, teams, and applications.

It offers extreme flexibility for embedding analytics into web or mobile products — with fully customizable UI/UX and brand-level control. Because Looker queries data in place (no extracts needed), it works seamlessly with any cloud data warehouse.

Best suited for:

  • SaaS products wanting embedded analytics
  • Enterprises needing governed, centralized metrics
  • Organizations working with multi-cloud data architectures

Key customization strengths:

  • Custom modeling with LookML
  • API-first platform for building tailored analytics experiences
  • Pixel-perfect control over front-end analytics

Qlik Cloud Analytics®

This BI solution stands out with its Associative Engine, enabling users to explore all possible relationships in data — not just predefined queries.

Qlik Cloud Analytics® offers high customization through extensions, custom visual scripting, and developer-friendly SDKs.

Best suited for:

  • Businesses with complex multi-source data
  • Data-intensive manufacturing, logistics, retail analytics
  • Teams needing exploratory analytics over rigid reporting

Key customization strengths:

  • Fully extensible dashboards with custom visualizations
  • In-memory engine for real-time exploration
  • Enterprise-grade architecture + advanced governance

ThoughtSpot Agentic Analytics Platform

ThoughtSpot uses AI and natural language search to generate insights — no SQL required. Its core superpower is search-driven analytics, making it incredibly self-service friendly. Developers can embed AI-powered analytics into other systems via APIs.

Best suited for:

  • Leaders who want insights instantly without analyst dependency
  • Data democratization initiatives
  • Sales, CX, operations teams requiring quick answers

Key customization strengths:

  • AI/ML insight recommendations
  • Conversational analytics + spotIQ automation
  • Embedded analytics and fully custom data workflows

Pricing:

  • Essentials (for small teams) – $25 per user/per month
  • Pro (for growing businesses) – $50 per user/per month
  • Enterprise (for large enterprises) – Custom pricing

GoodData

GoodData was designed specifically for composable and embedded analytics, enabling companies to create custom multi-tenant BI products.

It provides headless BI, meaning you can completely control the front-end experience through APIs.

Best suited for:

  • SaaS companies adding analytics into their product
  • Organizations requiring strict governance across different user groups
  • Data products with white-label branding

Key customization strengths:

  • Custom frontend development with React components
  • Fine-grained permissions for customer-facing analytics
  • Flexible data pipelines and governed metrics layer

Sisense

The app allows developers to embed analytics anywhere — portals, dashboards, web products, and even within app workflows.

Sisense Fusion lets you create data apps and tailor analytics experiences to specific business workflows.

Best suited for:

  • Enterprise analytics inside operational systems
  • Complex custom workflows + automation needs
  • Flexible, branded analytics in SaaS

Key customization strengths:

  • White-label dashboards
  • Highly customizable via scripts + API
  • Handles large, complex data models efficiently

Tableau

Tableau is the leader in advanced visualization design with deep customization options.

Developers can extend visual capabilities with JavaScript APIs, plugins, and Tableau Extensions for embedded use cases.

Best suited for:

  • Industries demanding visual analytics and storytelling
  • Enterprises scaling self-service dashboards
  • Teams transitioning from spreadsheets to BI

Key customization strengths:

  • Custom extensions + visual development
  • Full branding control for embedding
  • Massive library of visuals for almost any model

Pricing

  • Tableau Standard – $75 user/month
  • Tableau Enterprise – $115 user/month
  • Tableau + Bundle – Contact Sales

Mode Analytics

Mode unifies SQL + Python + R for analysts and data scientists — perfect for advanced modeling and statistical analytics.

It provides customizable reporting environments, allowing data teams to build powerful models and present insights interactively.

Best suited for:

  • Companies with strong data science / analytics teams
  • Growth-stage SaaS building tailored internal analytics
  • Experiment-heavy product teams

Key customization strengths:

  • Built-in notebooks for advanced ML analytics
  • Deep control over query models + custom visuals
  • Tailored embedded analytics for data-savvy products

Metabase

Metabase is an open-source, self-hosted BI tool — highly cost-efficient with full control over your deployment.

It’s simple for non-technical users yet customizable by engineering teams.

Best suited for:

  • SMEs avoiding licensing lock-in
  • Startups needing fast, low-cost BI
  • Data-sensitive industries that prefer on-premise

Key customization strengths:

  • Complete control over hosting + data
  • Custom dashboards with branding + embedding
  • Developer API for workflow integration

Pricing

  • Open source – Free
  • Starter – $100/month + $6/month per user
  • Pro – $575/month + $12/month per user
  • Enterprise – Custom pricing

Redash (Open Source)

Redash is a lightweight, SQL-first BI and dashboarding tool. Perfect for technical teams who want complete customization without heavy enterprise overhead.

Best suited for:

  • Advanced SQL/engineering-led analytics teams
  • Internal dashboards for operations, engineering, DevOps
  • API + CLI driven BI environments

Key customization strengths:

  • Full source code access = unlimited customization
  • Ideal for embedding minimal dashboards
  • Cost-efficient + developer-friendly

Important insight: There’s no “one-size-fits-all” BI tool — the best “Power BI alternative” depends on your business model, data architecture, user base, and long-term goals.

How to Evaluate & Implement an Alternative: Best Practices & Actionable Tips

Here’s a framework — built upon years of industry practice — that we at Andolasoft recommend when evaluating or implementing a BI alternative.

1. Define Business Goals & Data Strategy First

  • Clarify what you aim to achieve: improved reporting turnaround, real-time dashboards, embedded analytics in product, or self-service analytics for business users.
  • Map out your data sources (databases, data lakes, third-party services, APIs, IoT, logs, etc.).
  • Define KPIs, metrics, data governance, access controls, and which teams/users need what access.

This ensures that whichever BI platform you choose — or build — aligns precisely with business needs.

2. Prioritize Customization & Embeddability

  • If you need dashboards within your product — for SaaS or internal tools — prefer BI platforms that support embedded analytics or SDKs (e.g. Looker, GoodData, Sisense, Mode).
  • Keep the semantic layer or data model separate from the presentation layer. This avoids breaking dashboards when underlying data changes.

3. Adopt Modular, Scalable Data Architecture

  • Use a modern data stack: data warehouse / data lake (e.g. cloud-based), ETL/ELT pipelines, and analytical layer.
  • Apply DevOps / CI-CD practices to BI pipelines: treat data models, queries, dashboards as code — versioned, tested, and maintained like software.
  • Build with scalability & security in mind: scale as data grows, and enforce role-based access and data governance.

4. Empower Business Users & Maintain Governance

  • Enable self-service BI for non-technical users — so analysts, marketing, sales teams can run their own reports without IT bottlenecks.
  • But also enforce data governance, consistent definitions, and a central data model to avoid data silos or conflicting metrics.

5. Iterate, Gather Feedback, Evolve Dashboards

  • Treat BI as a living product, not a one-time deliverable. Collect feedback from end-users frequently.
  • Improve dashboards over time: refine visualizations, adjust metrics, add new data sources. This approach leads to more meaningful insights and better user adoption.

6. Leverage a Skilled Engineering Partner (When Needed)

Implementing or customizing BI — especially embedding dashboards, integrating data pipelines, ensuring security, and scaling — often requires full-stack engineering, DevOps, cloud architecture, and data expertise.

Here’s why working with a partner like Andolasoft really helps:

  • We offer Custom Web / Mobile App Development — integrating BI dashboards directly into enterprise or customer-facing products.
  • We bring BI, AI & Machine Learning Solutions — enabling advanced analytics, predictive modelling, and data-driven automation.
  • We deliver SaaS Product Engineering — ideal if you are building a SaaS product with embedded analytics.
  • We handle DevOps, Cloud & Automation — setting up scalable data pipelines, data warehouses, and secure infrastructure.
  • We manage Application Modernization & Enterprise IT Services — especially helpful when migrating from legacy BI systems or spreadsheets.

With this breadth, Andolasoft stands as a trusted technology partner to help you implement a BI solution that is not just functional — but tailored, scalable, and future-ready.

Customer Success

For example, a growing logistics company, partnered with Andolasoft to build an embedded analytics dashboard — using a combination of a cloud data warehouse, custom ETL pipelines, and a flexible BI tool. Within 4 months, they replaced multiple spreadsheets and legacy reporting tools with a unified, real-time analytics portal. As a result:

  • Reporting time reduced by 85%, from hours/days to real-time dashboards
  • Manual mistakes were eliminated — improving data accuracy and decision confidence
  • Operations management gained real-time visibility into fleet utilization, delivery times, and route performance — leading to 10% cost savings and 20% faster decision cycles

Here’s what changed: the company equipped its leadership and operations teams with actionable insights — enabling data-driven decisions, dynamic route planning, and quicker responses to changing demand.

Because Andolasoft built the solution end-to-end (data pipelines + BI + embedded dashboards), now has a scalable, maintainable analytics backbone that grows as the business expands.

Key Takeaways

  • Power BI alternatives can offer far greater customization, flexibility, and control — especially when you need embedded analytics, complex data modeling, or custom integrations.
  • A one-size-fits-all BI platform rarely fits all: the right solution depends on your business model, data strategy, and long-term goals.
    Implementing a modern BI system requires strong data architecture, governance, iterative development, and scalability — not just dropping in a tool.
  • Partnering with experts like Andolasoft — who combine BI, data, cloud, and full-stack development — ensures you build a robust, future-ready analytics solution.
  • The time to modernize your BI stack is now: as data volume and complexity grow, businesses that act early gain competitive advantage, operational efficiency and strategic agility.

By choosing one of these top Power BI alternatives — and by building thoughtfully — you unlock the power of data to drive growth, innovation, and impact.

Frequently Asked Questions

  • What makes “Power BI alternatives” necessary when Power BI is widely used?

While Power BI is popular and capable, many businesses need deeper customization, embedding, or data integration flexibility. Power BI alternatives often offer better control over the data model, custom UI/UX, or embedding capabilities — especially suitable for SaaS products, enterprise apps, and complex workflows.

  • Which Power BI alternative is best for embedding analytics in a SaaS product?

Platforms like Looker, GoodData, and Sisense stand out — because they support embedded analytics, composable architecture, and custom UI. They enable you to integrate dashboards directly into your SaaS application with custom branding and controlled user access.

  • Can small or mid-sized companies benefit from Power BI alternatives?

Absolutely. Lightweight or open-source tools such as Metabase, Redash, or Mode Analytics offer affordable, flexible, and self-hosted options. They are ideal for companies wanting to avoid vendor lock-in or requiring full control of data infrastructure.

  • Is it possible to migrate from Power BI to another BI platform?

Yes — with a clear data strategy and planning. Migration typically involves exporting data models, rebuilding dashboards, setting up ETL/data pipelines, and reconfiguring permissions. Engaging a partner experienced in data migration and BI integration (like Andolasoft) can make the transition smooth and efficient.

  • What are common mistakes companies make when implementing a new BI platform?

Some common mistakes include: skipping data governance and data strategy planning; treating BI as a one-time project (rather than ongoing); neglecting scalability, security, and performance requirements; underestimating the need for DevOps in data pipelines; and not involving end-users in dashboard design, resulting in poor adoption.

  • How can Andolasoft help with implementing a customized BI solution?

Andolasoft offers end-to-end services — from data architecture, ETL pipelines, data warehouses, to analytics, embedded dashboards, and DevOps. We help you build scalable, secure, tailored BI solutions that align with your business goals and adapt as you grow.

Managed Superset Hosting: Why Cloud-Based BI is a Game-Changer

Business Intelligence (BI) is no longer a luxury—it’s a necessity. As organizations become more data-driven, they need tools that offer speed, scalability, and simplicity. While Apache Superset is one of the most powerful open-source BI platforms available today, hosting and managing it in-house can be complex and time-consuming.

That’s where Managed Superset Hosting comes in.

By moving Superset to the cloud through a managed service provider like Andolasoft, businesses get all the power of Superset with none of the operational headaches. In this blog, we explore why cloud-based Superset hosting is a game-changer for modern enterprises and growing startups alike.

What is Managed Superset Hosting?

Managed Superset Hosting means running Apache Superset in a cloud environment, fully maintained by experts. This includes setup, configuration, performance optimization, scaling, updates, and security, so you can focus on analyzing data instead of managing infrastructure.

At Andolasoft, our Superset BI Services deliver a fully managed, enterprise-grade Superset environment with zero licensing fees and full technical support.

Why Cloud-Based BI is a Game-Changer

Zero Setup Hassles — Go Live Faster

Hosting Superset in the cloud means

  • No need to provision servers or install dependencies
  • No manual upgrades or patching
  • Instant availability of dashboards and analytics tools

You can go from zero to live BI dashboards in a matter of days, not weeks.

Scalability That Grows With You

Your BI platform should never slow you down. With managed hosting, Superset is deployed on a scalable cloud infrastructure that automatically adjusts to:

  • Increasing data volumes
  • More concurrent users
  • Complex analytics workloads

Whether you’re a startup or a growing enterprise, your Superset setup will scale seamlessly.

Enterprise-Grade Security and Compliance

Data security is non-negotiable. Managed Superset Hosting includes:

  • Encrypted data transfers (SSL/TLS)
  • Role-Based Access Control (RBAC)
  • SSO and LDAP integration
  • Audit logs and activity tracking
  • Compliance support (HIPAA, GDPR, SOC 2)

This ensures your business intelligence infrastructure stays secure and compliant without needing a dedicated security team.

24/7 Monitoring and Support

Downtime or performance lags can cost you business. With managed hosting, your Superset instance is

  • Monitored continuously for performance and uptime
  • Backed by a team of BI experts
  • Optimized for speed, reliability, and uptime

This means peace of mind and guaranteed availability, even during peak usage.

Connect to 60+ Data Sources, Instantly

With Andolasoft’s managed Superset hosting, you can plug into:

  • SQL databases (MySQL, PostgreSQL, Oracle, etc.)
  • Cloud data warehouses (BigQuery, Snowflake, Redshift)
  • Marketing and CRM tools (Google Ads, Salesforce, HubSpot)
  • Financial and HR systems (Stripe, QuickBooks, BambooHR)

No custom coding. No integration bottlenecks. Just seamless data access.

No Vendor Lock-In

Superset is open-source, and with managed hosting:

  • You maintain full control over your data and dashboards
  • You can export or migrate anytime
  • You’re not tied to a proprietary BI license model

This gives you freedom, flexibility, and future-proofing.

Embedded Dashboards, Anywhere You Need

Need to display Superset dashboards inside your SaaS product, internal portal, or customer reports?

Managed Supersets Hosting supports secure dashboard embedding, allowing you to

  • Provide real-time insights to your users
  • Create role-based reporting experiences
  • Deliver custom analytics in your workflow

This is perfect for product teams, client reporting, and embedded BI use cases.

Why Choose Andolasoft for Superset BI Hosting?

We’re not just hosting Superset—we’re optimizing it for performance, scale, and business outcomes.

  • Expert setup, support, and customizations
  • Scalable cloud infrastructure (Docker/Kubernetes)
  • Seamless integration with your data ecosystem
  • 200+ ready-to-use dashboards across industries
  • Flexible plans for startups and enterprises

Get Started in Days, Not Weeks

Ready to simplify your BI infrastructure and unlock powerful, real-time analytics?

  • Explore our live dashboard gallery
  • Book a free consultation with our Superset experts
  • Start your managed Superset journey with Andolasoft

Fully managed, scalable, yours.

Why Apache Superset is the Future of Open-Source Business Intelligence

In a world where data is the new oil, businesses are under increasing pressure to quickly turn raw information into actionable insights. But traditional business intelligence (BI) platforms like Tableau, Power BI, and Qlik often come with high costs, steep learning curves, and vendor lock-ins.

That’s where Apache Superset stands out.

Originally built by Airbnb and now an Apache Software Foundation project, Superset has rapidly evolved into a leading open-source BI solution. With its intuitive UI, robust analytics capabilities, and enterprise-grade scalability without licensing fees, Superset empowers organizations of all sizes to take full control of their data strategies.

In this article, we explore why Apache Superset is not just a BI tool but the future of open-source business intelligence.

What is Apache Superset?

Apache Superset is a modern, lightweight, open-source data exploration and visualization platform. It allows users to:

  • Connect to a wide variety of data sources
  • Perform ad-hoc analysis through a user-friendly SQL editor
  • Create and share rich, interactive dashboards
  • Embed insights seamlessly into apps and portals

What makes Superset truly powerful is its ability to deliver all of this with no vendor lock-in, complete customizability, and the backing of a strong open-source community.

Whether you’re a data analyst, a data scientist, or a business user, Superset’s versatile platform makes it easy to turn data into decisions.

Key Reasons Superset is Leading the BI Revolution

Open-Source and Cost-Effective

Unlike proprietary BI tools that require expensive licenses and per-user fees, Apache Superset is free to use. This dramatically reduces the total cost of ownership (TCO) and makes it an ideal choice for startups, SMBs, and large enterprises looking to cut costs without sacrificing capability.

Moreover, open source means complete transparency, freedom from vendor lock-in, and the ability to audit or extend the software as needed.

Powerful, Interactive Dashboards

Superset enables users to create beautiful and highly interactive dashboards with

  • Real-time filters
  • Drill-down capabilities
  • Custom charts and graphs
  • Responsive design for desktop and mobile

Users can explore metrics in depth, identify trends, and make data-backed decisions quickly—all through an intuitive drag-and-drop interface. With over 40 pre-built visualizations and support for custom chart plugins, Superset covers everything from bar charts to complex geospatial heatmaps.

Scalable Architecture for Big Data

Superset is built on a cloud-native, distributed architecture. It leverages technologies like Flask, SQLAlchemy, and Apache ECharts to efficiently handle:

  • High user concurrency
  • Massive datasets (millions of rows)
  • Complex queries and joins

Whether you’re running Superset on a local server or deploying it on Kubernetes in a cloud environment, it can scale with your growing analytics needs. You can also integrate it with caching layers like Redis or external query engines like Presto for even faster performance.

Broad Data Source Compatibility

Superset supports any SQL-speaking data source, including

  • Relational databases: PostgreSQL, MySQL, MariaDB, Oracle
  • Data warehouses: Snowflake, Amazon Redshift, Google BigQuery
  • Big data engines: Apache Druid, Apache Hive, Presto, Trino
  • Cloud-native platforms: AWS Athena, Azure Synapse, ClickHouse

This means you can connect all your structured data pipelines in one place and analyze them with a single BI interface—no need to switch between multiple platforms.

Highly Extensible and Developer-Friendly

Superset is more than a tool—it’s a framework. For engineering teams, it provides:

  • REST APIs for programmatic access
  • A plugin system to create custom visualizations
  • RBAC (Role-Based Access Control) for enterprise-grade security
  • OAuth, LDAP, and SSO integrations
  • Dashboard embedding into web apps (e.g., for SaaS or internal tools)

You can tailor it to your organization’s workflow, brand it for your customers, or use it to power your analytics product.

Real-World Use Cases

Apache Superset is making a tangible impact across sectors:

  • SaaS & Tech: Monitor MRR, churn rate, feature usage, and system performance in real time with embedded dashboards for internal and customer-facing views.
  • Healthcare: Visualize patient intake, appointment wait times, and medical outcomes. Track clinical KPIs securely with HIPAA-compliant setups.
  • Retail & E-Commerce: Analyze sales by SKU, region, or channel. Combine real-time inventory data with marketing campaign metrics to optimize conversion rates.
  • Finance & Insurance: Track portfolio performance, detect anomalies in transaction data, and generate regulatory reports dynamically.
  • Education: Measure student performance, attendance trends, and course engagement across multiple campuses or digital platforms.

The Growing Community and Ecosystem

As a top-level project under the Apache Software Foundation, Superset benefits from

  • A vibrant developer and user community
  • Frequent updates and feature enhancements
  • Active GitHub contributions and community support

Additionally, organizations like Andolasoft offer end-to-end Superset services, including

  • Custom development
  • Deployment on AWS, Azure, or GCP
  • Dashboard design & data integration
  • Long-term support and training

This ecosystem makes it easier than ever to adopt Superset and tailor it to your business needs.

Conclusion

Apache Superset is redefining the future of business intelligence.

With its open-source foundation, rich visual capabilities, high performance, and developer-friendly architecture, Superset gives organizations the freedom, flexibility, and power they need to own their analytics.

Whether you’re looking to modernize legacy BI infrastructure, reduce BI costs, or embed analytics into your products, Superset offers a scalable, customizable solution that can grow with your data and your business.

Ready to unlock the power of open-source BI with Apache Superset?

  • Explore our live dashboard gallery—over 200 interactive dashboards across industries
  • Schedule a free Superset consultation with our BI experts to discuss how we can tailor it to your needs
  • Get started with deployment or migration services backed by our experienced engineers

Let Andolasoft help you build a smarter, more agile data strategy with Superset at its core.