Every dollar counts when you run a startup or SME. Yet most companies waste $50,000 to $120,000 per year on business intelligence (BI) tools they barely use. However, there is a smarter way in 2026 — and it costs almost nothing to start. Apache Superset BI savings are real. Apache Superset is the world’s most popular open-source BI platform, trusted by Airbnb, Nielsen, and thousands of fast-growing companies. Moreover, it gives your team powerful dashboards, deep analytics, and stunning data visualization — without the enterprise price tag that breaks budgets.
In this guide, you will discover exactly how Apache Superset delivers massive BI savings. You will also learn which features make it the best choice in 2026. Additionally, see how Andolasoft’s Superset BI Services help you unlock those savings faster than ever before.
What Is Apache Superset and Why It Matters in 2026
Apache Superset is a modern, open-source BI platform. It was originally developed by Airbnb and later donated to the Apache Software Foundation. Therefore, the software is completely free to use under the Apache 2.0 license.
In 2026, the BI software market will reach $33.3 billion (Gartner). However, most of that spend goes to licensing fees — not actual insights. Apache Superset flips this model. You pay for infrastructure only, not software. As a result, your budget goes toward real analytics value.
At Andolasoft, our Superset BI Services team has deployed Apache Superset for clients across NBFC, BFSI, retail, and SaaS sectors. Furthermore, we consistently see companies slash their BI spend by 60% to 80% within the first year of migration.
Key Facts About Apache Superset
- Over 50,000+ GitHub stars — one of the most loved open-source BI projects globally
- Connects to 40+ databases including PostgreSQL, MySQL, BigQuery, Snowflake, and Redshift
- Fully REST API-enabled for seamless integration with your existing tech stack
- Built-in SQL Lab lets teams write complex queries without a separate database tool
- Supports role-based access control (RBAC) to protect sensitive business data
The Real Cost of Traditional BI Tools in 2026
Most organizations do not realize how much they overpay for BI. Let’s look at the hard numbers hurting your bottom line right now.
Tableau charges $70–$115 per user per month. For a 50-person team, that is $42,000–$69,000 per year. Importantly, this does not include training, implementation, or support costs. Power BI is cheaper, however it locks you into the Microsoft Azure ecosystem at $10–$20 per user per month.
Beyond licensing, traditional BI platforms create hidden costs that compound quickly. These include vendor lock-in, expensive consultants for customization, and complex pricing tiers that punish growth. Therefore, switching to Apache Superset is a straightforward decision for most SMEs.
💡 Real Cost Impact: A 50-person team on Tableau spends up to $69,000/year on licensing alone. Switching to Apache Superset with managed hosting reduces this to just $3,000–$8,000/year. That is a saving of up to $61,000 annually.
Furthermore, traditional tools require specialized consultants just to build basic reports. In contrast, our Data Analytics services team enables your internal users to self-serve insights — eliminating costly dependency on outside experts.
How Apache Superset Delivers Massive BI Savings
Apache Superset does not just replace expensive BI tools. It actively creates financial advantages across your entire data operation. Here is how the savings stack up.
Zero Licensing Costs
Apache Superset is 100% open-source under the Apache 2.0 license. You pay nothing for the software itself. Consequently, your only costs are cloud hosting and optional expert implementation — both a fraction of traditional licensing fees.
Reduced Vendor Lock-In
Because Superset is open-source and database-agnostic, you are never trapped with one vendor. If you switch from MySQL to Snowflake, your dashboards follow seamlessly. Moreover, this flexibility pairs beautifully with our Cloud & Infrastructure Services, where we help you build portable, cost-efficient data pipelines.
Faster Time-to-Insight
Traditional BI implementations take 6–12 months. They also cost $80,000–$200,000 in professional services. However, a managed Apache Superset deployment with Andolasoft launches in just 4–8 weeks. This cuts time-to-value by up to 70%.
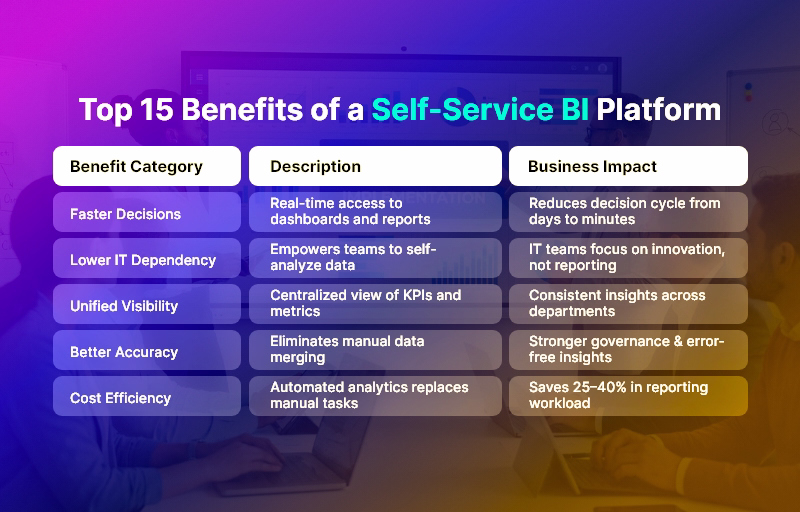
Self-Service Analytics
Superset empowers business users — not just data engineers — to build their own dashboards. This dramatically reduces analyst workload. Additionally, combined with Intelligent Automation, teams can schedule automated reports and alerts without ongoing manual effort.
Top 7 Ways Apache Superset Cuts Your BI Budget in 2026
Here are the seven proven ways Apache Superset delivers measurable cost savings for SMEs and startups.
- Eliminates Software Licensing: No per-seat fees exist. There are zero annual license renewals. Your entire organization can access Superset simultaneously at no extra cost.
- Reduces Infrastructure Costs: Superset runs efficiently on cloud instances from just $200–$500/month for most SMEs. This compares to $4,000–$8,000/month for enterprise BI SaaS plans.
- Cuts Consultant Dependency: Superset’s intuitive drag-and-drop interface means business analysts build dashboards independently. As a result, costly consultant hours reduce by up to 60%.
- Accelerates Data-Driven Decisions: Faster insights mean faster pivots. Companies using Superset report 35% faster decision cycles. This directly translates to measurable revenue impact.
- Integrates With Existing Tools: Superset connects natively to your Python stack, React frontend, and existing databases. Specifically, our Python Development team optimizes these integrations for peak performance.
- Enables Unlimited Users: Unlike Tableau’s per-seat pricing, Superset scales to any team size at no additional cost. Therefore, adding 100 new users costs the same as adding 10.
- Powers Financial Analytics: For NBFC and BFSI sectors, Superset powers specialized use cases like our Loan Analytics System and Loan Monitoring System — replacing expensive proprietary financial BI tools entirely.
Apache Superset vs. Tableau vs. Power BI — 2026 Cost Comparison
Numbers speak louder than claims. Here is how Apache Superset compares against Tableau and Power BI on the metrics that matter most to budget-conscious teams in 2026.
| Feature | Apache Superset | Tableau | Power BI |
|---|---|---|---|
| License Cost | Free (Open-Source) | $70–$115/user/mo | $10–$20/user/mo |
| Annual Cost (50 Users) | ~$0 (hosting only) | $42,000–$69,000 | $6,000–$12,000 |
| Cloud Hosting | Any cloud provider | Tableau Cloud only | Azure only |
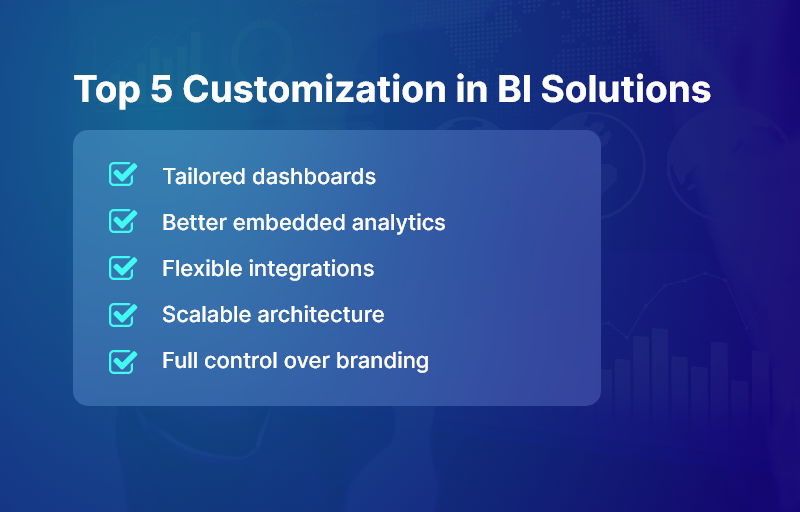
| Custom Dashboards | Unlimited | Limited | Limited |
| SQL Editor Built-in | Yes | Not included | Partial |
| Open-Source | Apache 2.0 | Proprietary | Proprietary |
| Vendor Lock-in | None | High | Medium |
The verdict is clear. Apache Superset delivers enterprise-grade BI at a fraction of the cost. Moreover, for BFSI and NBFC organizations, the advantage is especially strong. Our specialized BFSI Data Analytics and NBFC Data Analytics solutions show exactly how industry-specific Superset deployments maximize this advantage.
Real-World Use Cases: Companies Saving Big With Apache Superset
Theory is useful. However, real results build conviction. Here are three organizations achieving meaningful BI savings with Apache Superset right now.
Use Case 1: NBFC Company Cuts Reporting Costs by 72%
A mid-sized NBFC was spending $84,000 per year on a proprietary loan reporting platform. After Andolasoft migrated them to Apache Superset — integrated with our NBFC Data Analytics framework — their annual BI cost dropped to $23,500. That is a saving of $60,500 per year. Additionally, they gained better dashboard performance and real-time loan monitoring.
Use Case 2: SaaS Startup Achieves BI in 5 Weeks
A SaaS company needed investor-ready dashboards but had no BI budget. Using Andolasoft’s Superset BI Services and our ReactJS Development team, they launched a full BI layer in just 5 weeks for under $12,000. In comparison, a Tableau implementation quote from another vendor had come in at $95,000.
Use Case 3: Enterprise Team Consolidates 6 Tools Into 1
An enterprise project management team was juggling six separate reporting tools. Our Enterprise Project Management solution consolidated all reporting into a single Superset instance. As a result, they achieved a 68% reduction in reporting overhead and 40% faster team reporting cycles.
How Andolasoft’s Superset BI Services Maximize Your ROI
Implementing Apache Superset correctly is the difference between transformational savings and a frustrating half-deployed tool. Therefore, Andolasoft’s Superset BI Services provide end-to-end expertise — from architecture design to dashboard delivery — so you realize full ROI from day one.
- Application Modernization: We modernize legacy reporting systems before migrating to Superset. Consequently, you get zero data loss and a smooth, risk-free transition.
- AI Framework Services: We integrate machine learning models into your Superset dashboards. This enables predictive analytics alongside standard reporting.
- Digital Strategy & Transformation: We align your Superset implementation with your broader digital roadmap. As a result, you maximize long-term data ROI.
- Enterprise Integration: We connect Superset to your ERP, CRM, and operational databases using industry-standard integration patterns.
- Digital Governance Solutions: We ensure your Superset implementation meets regulatory and compliance standards — especially critical in BFSI and healthcare sectors.
For project teams, tools like OrangeScrum pair powerfully with Superset dashboards. Together, they connect project data directly to business analytics, building integrated and cost-efficient operations.
Key Features That Make Apache Superset the Best BI Choice in 2026
Apache Superset is not just affordable. It is genuinely powerful. Here are the features that make it the smartest BI investment for any SME or startup in 2026.
Rich Chart Library
Superset ships with 40+ chart types — from bar charts and heat maps to advanced funnel charts and geospatial visualizations. Furthermore, our Geo-Spatial Engineering & Services team extends these capabilities with custom map layers for logistics and field operations.
SQL Lab for Power Users
Business analysts and data engineers love Superset’s built-in SQL Lab. It supports multi-tab querying, query history, auto-complete, and results download. Therefore, teams no longer need separate database GUI tools.
Role-Based Access Control
Superset’s enterprise-grade RBAC ensures each user sees only the data they are authorized to view. This is critical for Digital Governance Solutions compliance — particularly in regulated sectors like banking and healthcare.
Embedded Analytics
Superset dashboards embed directly into your product or customer portal via its REST API. Combined with Andolasoft’s ReactJS Development expertise, we build seamless embedded analytics experiences that differentiate your product.
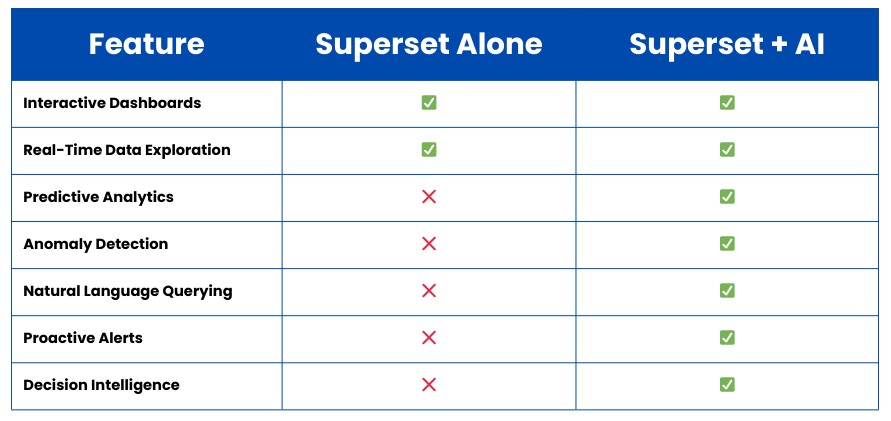
Autonomous AI Assistant Integration
In 2026, Superset integrates powerfully with Autonomous AI Assistants to enable natural language querying. Users simply type a question and get instant answers — no SQL knowledge required.
Step-by-Step: Getting Started With Apache Superset
Ready to deploy Apache Superset? Here is the practical 7-step path to your first dashboard and your first BI savings.
- Audit Your Current BI Stack: Document all existing BI tools, their costs, and actual usage rates. Most teams discover 40% of their BI seats are unused.
- Define Dashboard Requirements: Identify the 5–10 most critical dashboards your team uses daily. These become your migration priority.
- Choose Your Cloud Infrastructure: Select a cloud provider for Superset hosting. AWS, GCP, and Azure all work excellently. Our team right-sizes your environment for cost efficiency.
- Connect Your Data Sources: Use Superset’s connection wizard to link your existing databases and data warehouses in minutes.
- Build Your Dashboards: Use Superset’s drag-and-drop chart builder to recreate critical dashboards — or let Andolasoft’s team handle it for you.
- Train Your Team: Superset’s learning curve is gentle. Most business users become productive within 2–3 hours of training.
- Monitor and Optimize: Use Superset’s built-in query performance metrics to identify slow dashboards and optimize your data models over time.
For payroll-linked analytics in workforce planning, consider pairing Superset with IndPayroll — enabling seamless HR cost reporting directly within your BI dashboards.
The Future of BI Savings: What’s Coming After 2026
Apache Superset continues to evolve rapidly. The 2026 roadmap includes native AI-powered chart recommendations, enhanced Innovation & Product R&D integrations, and improved real-time streaming dashboard support. Therefore, the cost-savings case for Apache Superset will only strengthen over time.
Additionally, as Shopify eCommerce Solutions grow in sophistication, Superset becomes the natural analytics layer for e-commerce operators. Consequently, businesses understand customer behavior, inventory trends, and campaign performance — all without paying premium analytics fees.
Furthermore, teams using our Software Quality Assurance services alongside Apache Superset benefit from rigorous testing of every dashboard. This ensures data accuracy and builds trust across your entire organization.
Conclusion: Your Apache Superset BI Savings Start Today
The evidence is clear. Apache Superset delivers enterprise-grade BI at open-source prices. For SMEs, startups, and project teams, this is one of the highest-ROI technology decisions available in 2026. Therefore, now is the perfect time to make the switch.
You do not need a million-dollar budget to have million-dollar data insights. Apache Superset — expertly implemented by Andolasoft — gives your team the analytical power to compete at the highest level. Moreover, you will spend a fraction of what your competitors pay for legacy BI tools.
Explore our full range of Superset BI Services and read more expert guides on our Andolasoft Blog. Your journey to smarter, leaner BI starts now. Additionally, explore CRMLeaf to see how data-driven CRM integrates seamlessly with your new BI strategy.
Frequently Asked Questions About Apache Superset BI Savings
1. What is Apache Superset and how does it save money?
Apache Superset is a free, open-source BI platform. It replaces costly tools like Tableau and Power BI. Since the software itself is free, your only costs are hosting and optional implementation. As a result, SMEs typically save $30,000–$60,000 per year compared to enterprise BI licensing.
2. Is Apache Superset suitable for small businesses?
Absolutely. Apache Superset is ideal for small and medium businesses precisely because it scales efficiently. You can start with a minimal cloud instance for under $200 per month. Furthermore, you scale only as your data needs grow — with zero increase in licensing costs.
3. How does Apache Superset compare to Power BI in 2026?
Apache Superset is completely free, while Power BI costs $10–$20 per user per month. Superset is also database-agnostic — it is not locked to Azure. Additionally, it supports embedded analytics more flexibly and includes a built-in SQL editor that Power BI lacks.
4. Can Apache Superset connect to my existing databases?
Yes. Apache Superset connects to 40+ data sources out of the box. These include PostgreSQL, MySQL, Snowflake, BigQuery, Redshift, and SQL Server. Moreover, Andolasoft’s team can build custom connectors for proprietary or legacy systems when needed.
5. How long does it take to deploy Apache Superset?
A standard Apache Superset deployment by Andolasoft takes 4–8 weeks from kickoff to go-live. This includes infrastructure setup, database connections, initial dashboard migration, and team training. Therefore, you get value significantly faster than traditional enterprise BI implementations.
6. Is Apache Superset secure enough for financial data?
Yes. Apache Superset includes enterprise-grade RBAC, SSL/TLS encryption, and audit logging. Furthermore, Andolasoft’s implementations — backed by our Enterprise IT Security services — add additional security hardening aligned with banking and financial services compliance requirements. Consequently, your sensitive data stays fully protected.
7. Do I need a dedicated data engineering team to use Superset?
No. While a data engineer is helpful for initial setup, Superset’s business-user-friendly interface allows analysts and non-technical managers to build dashboards independently. Additionally, Andolasoft provides training to ensure your team becomes self-sufficient quickly.
8. Can Apache Superset handle real-time data?
Yes. Apache Superset supports real-time and near-real-time dashboard refresh rates depending on your data source configuration. For streaming use cases, Andolasoft integrates Superset with Apache Kafka or similar streaming platforms. As a result, you get live operational dashboards when you need them.
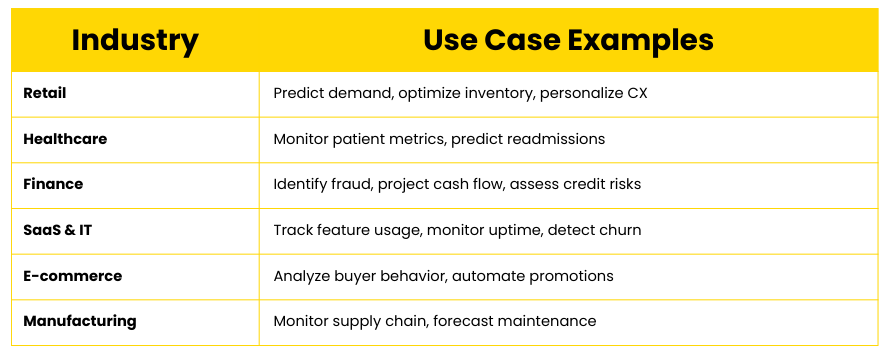
9. What industries benefit most from Apache Superset BI savings?
Apache Superset delivers particularly strong ROI in NBFC, BFSI, SaaS, retail, healthcare, logistics, and manufacturing sectors. However, any industry with high data volume and a need for cost-efficient reporting can benefit enormously from a well-implemented Apache Superset solution.
10. How do I get started with Andolasoft’s Apache Superset services?
Getting started is simple. Visit Andolasoft‘s Superset BI Services page to explore our implementation packages. Alternatively, sign up for a free CRMLeaf trial to experience data-driven business management firsthand. Our team is ready to help you design the optimal Superset solution for your specific goals and budget.