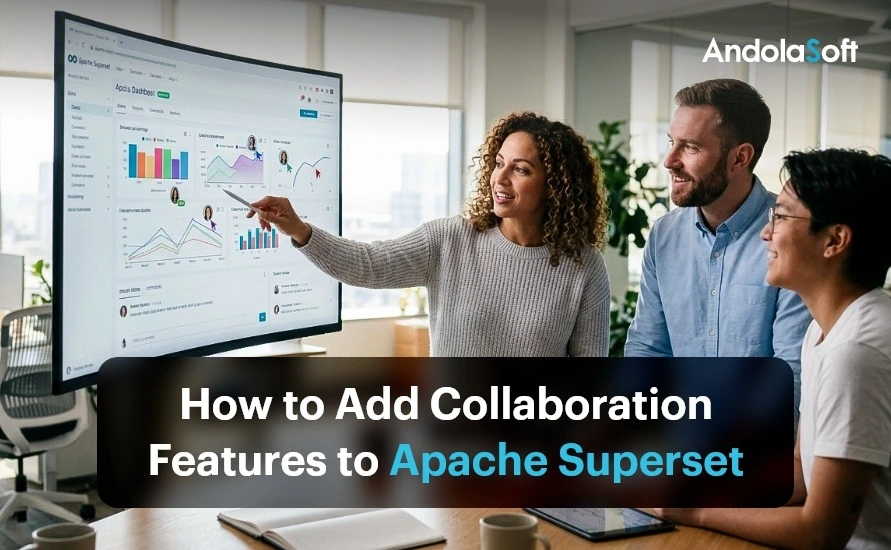
How to Add Collaboration Features to Apache Superset

Apache Superset has become one of the most widely deployed open-source analytics platforms in the world. It connects to virtually any SQL database, renders rich interactive dashboards, and costs nothing per seat. But teams that adopt it quickly discover a gap: Superset ships without built-in Apache Superset collaboration features. Analytics is a team sport, yet Superset, out of the box, is built for viewing, not for discussing. There are no dashboard comments and no way to annotate a chart. There is also no folder tree to organise a growing library of dashboards.

The result is familiar to anyone who has run a review meeting from a BI tool. Someone screenshots a chart, pastes it into an email or chat thread, and circles the anomaly in a paint tool. The discussion about the data happens everywhere except next to the data. Context is lost, and decisions go undocumented. Three weeks later, nobody remembers why anyone queried the number or what the team agreed.

This article explains what Superset offers natively, plus three practical ways to add Apache Superset collaboration features on top of it. It also shows how Andolasoft builds them as clean, upgrade-safe extensions for enterprise clients.

What Superset Supports Natively, and Where the Gaps Are

Superset’s native collaboration surface is real but thin. Dashboards can be shared by link and published or kept as drafts. Ownership controls who can edit them. Tags let you label dashboards and filter the list page. Role-based access control and row-level security govern who sees what. Alerts and reports can be emailed or rendered in a dashboard on a schedule.

What is missing is the conversational layer: no inline comments, no visual markup, no review workflow, and no hierarchical folders. Tags can stand in for folders on the list page. But business users outside BI tools find a flat, filterable list a poor substitute for a browsable library. These gaps are consistently the top adoption complaints from non-technical stakeholders.

Three Ways to Add Apache Superset Collaboration Features

1. Pinned Comments and Visual Annotations on Dashboards

The highest-value addition is an in-dashboard markup layer. A reviewer opens a dashboard and clicks the exact chart in question. They pin a comment there, with a priority and a status, so the team can track it to resolution. Alongside pins, a drawing toolkit adds boxes, arrows, freehand marks, highlights, and text. Reviewers can mark up the live dashboard the way they would mark up a PDF. They can then save the annotation set for others to see.

Mechanically, a lightweight companion app delivers this feature inside Superset itself. It renders the target dashboard in an overlay and stores pins and drawings in your own database. Because it runs behind Superset’s session, the system attributes every comment to an authenticated user. And because it reuses Superset’s authentication, enabling Single Sign-On for Superset also enables it for the markup layer. Reviewers who never build charts just need a URL, their corporate login, and a pencil.
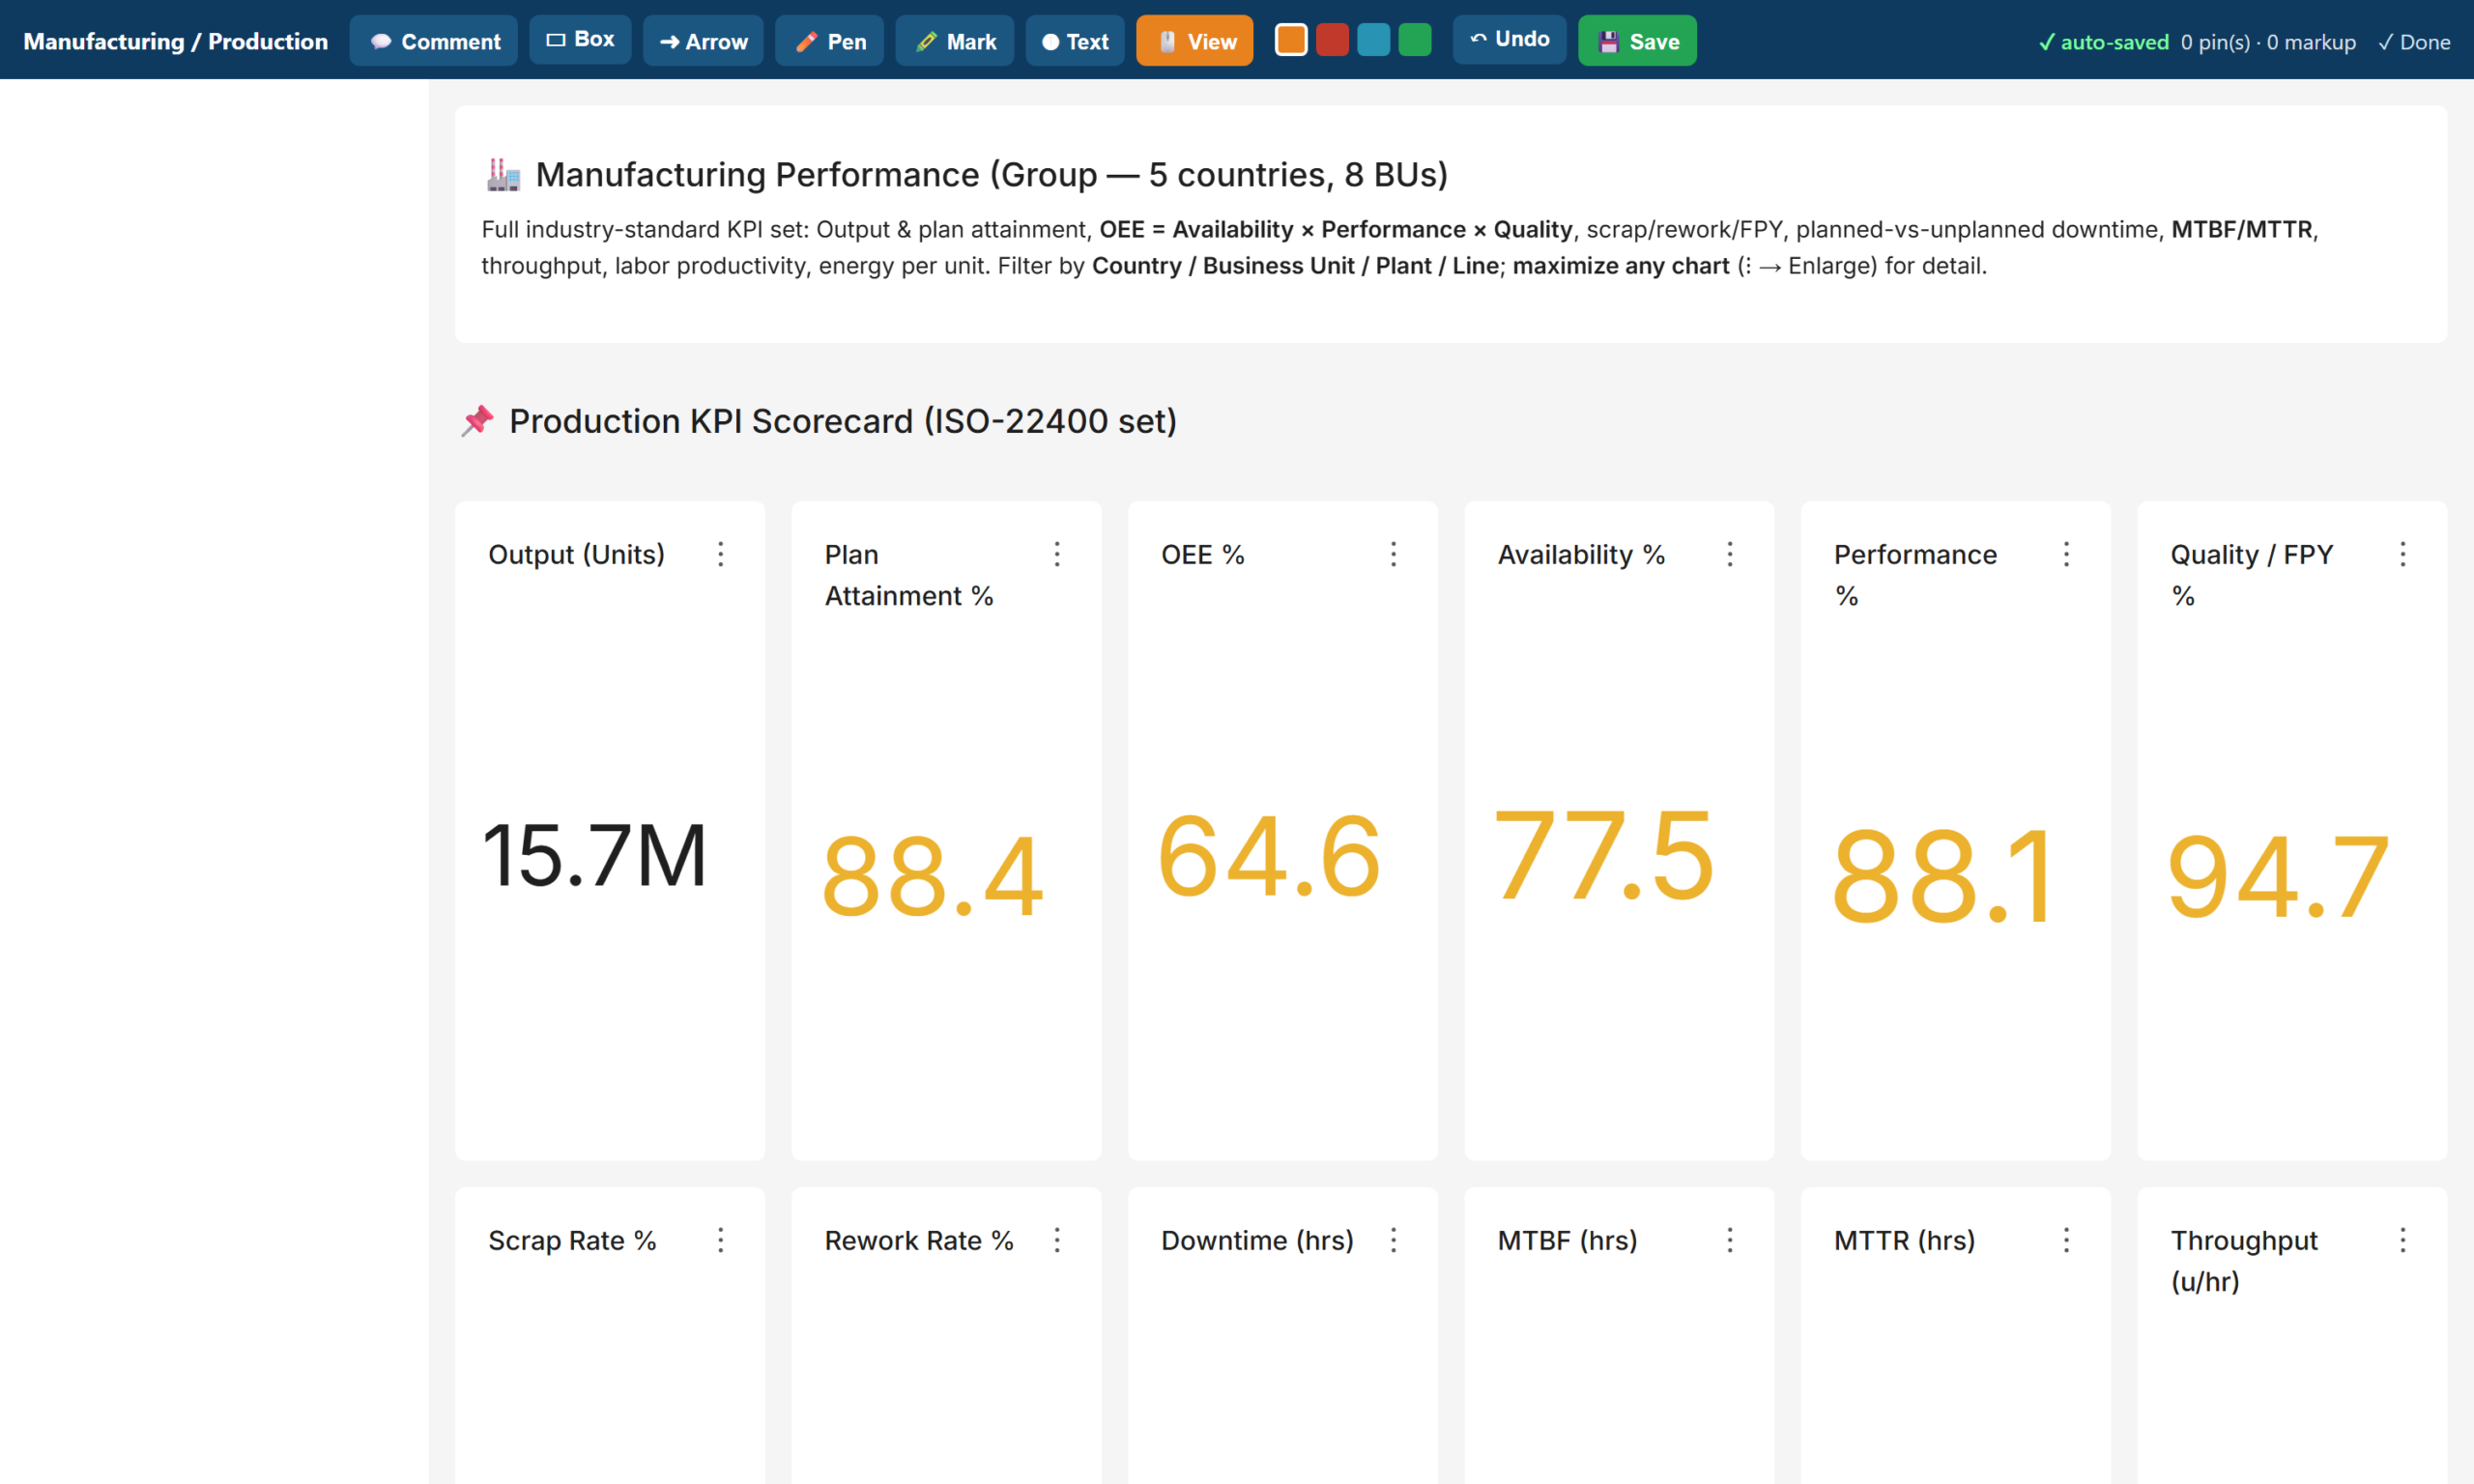
collaboration_markup

2. Folder-Style Navigation with Previews, Tags, and Search

The second addition solves discovery. A folder app presents the dashboard estate as a set of coloured folder cards, one per function. Examples include Executive, Sales, Finance, and Operations. Opening a folder shows each dashboard as a card with a live preview thumbnail, its tags, and a chart count. Clicking a card opens a full preview with a jump-through to the real dashboard. A search box filters across every folder by title or tag.
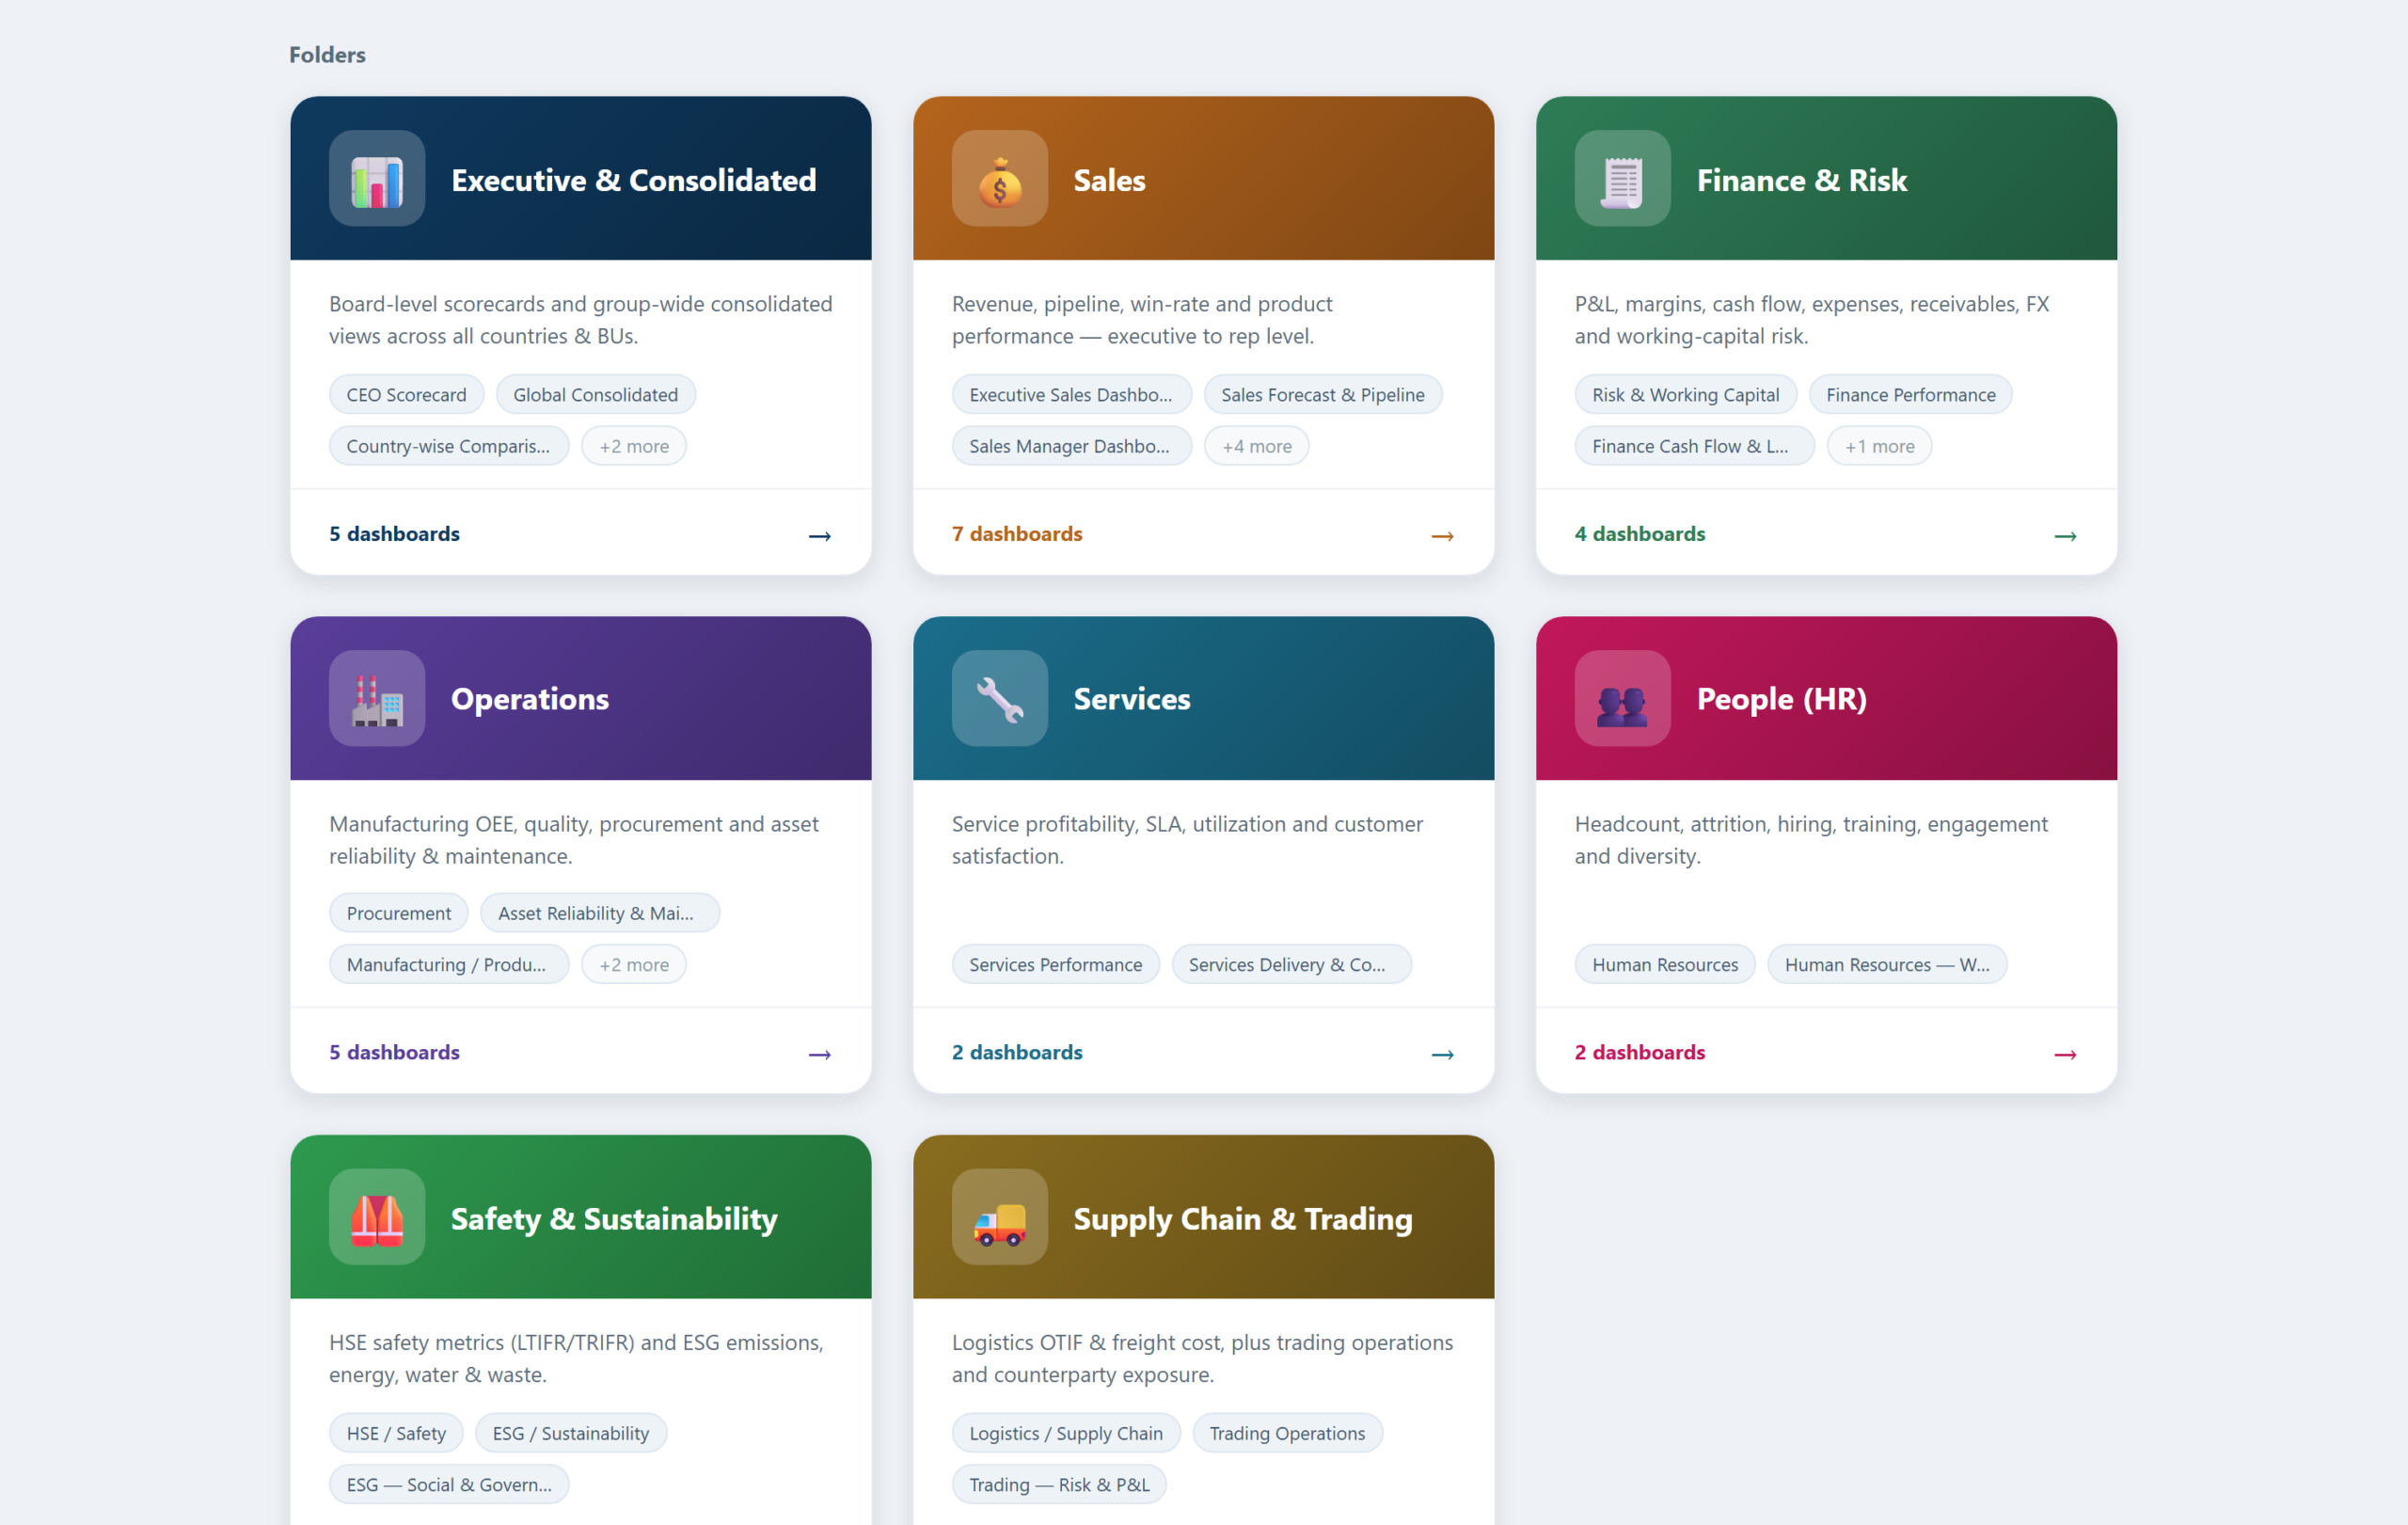
collaboration_folders

The important design decision: folders generate live from the dashboard titles and tags already in Superset. The library maintains itself. Publish a new dashboard, and it appears in the right folder immediately, complete with its preview and tags. It’s instantly searchable too. No curator required.

3. Tags, RBAC, and Row-Level Security as the Governance Layer

Collaboration without governance becomes noise. The third layer is configuration, not code. A tag taxonomy, organised by department and by audience, powers both the native list filters and the folder app. Roles separate admins, editors, and viewers. Row-level security lets a country manager see their country and a business-unit head see their unit. Single Sign-On ties all of it to the corporate identity provider. Together, these controls make the collaborative layer trustworthy: every comment is attributable, and nobody annotates data they should not see.

How Andolasoft Builds Apache Superset Collaboration Features, Upgrade-Safely

The naive way to add features to Superset is to fork it and edit the source. That works until the next Superset release, at which point every upgrade becomes a merge conflict. Our implementations follow a stricter rule: never patch core.

  • Extensions, not forks: Flask blueprints deliver the comment, annotation, and folder apps alongside Superset. They use its session, authentication, and metadata, but touch none of its source files.
  • Your data, your database: pins, drawings, and folder definitions live in your PostgreSQL database. The team versions and backs them up with everything else.
  • Upgrade-safe by construction: we modify nothing in the core. A Superset version upgrade becomes a container-image bump plus a regression pass, not a re-implementation.
  • Security inherited, not duplicated: the apps inherit Superset’s login, so SSO, roles, and row-level security apply automatically.

What Changes for the Team

  • Reviews happen in context: feedback lands on the exact chart, with an author and a timestamp. It replaces the old screenshot thread.
  • Meetings get shorter: pre-meeting comments mean the meeting starts at the decision, not at the description of the problem.
  • Nothing falls through the cracks: comments carry a status. The team either resolves each query or leaves it visibly open.
  • The library invites browsing: non-technical users navigate a folder library with previews and search instead of a flat list. Adoption follows.

Frequently Asked Questions

Can You Add Apache Superset Collaboration Features Like Comments?

Not natively. In practice, though, a lightweight companion app can add Apache Superset collaboration features to any dashboard. These include pinned comments and visual annotations. It runs on Superset’s own login and SSO, and stores everything in your own database.

Does Superset have folders for dashboards?

No. Tags provide folder-like filtering on the dashboard list. A custom folder app can add full card-based navigation, with live previews, tags, and search. It generates automatically from the dashboards you already have.

Will Apache Superset Collaboration Features Break on Upgrade?

Not if you build them as extensions rather than source patches. Flask-blueprint apps that sit alongside an unmodified Superset core survive version upgrades with a simple regression pass.

Do reviewers need a Superset licence or training?

Superset is open source, so there are no licences at all. Reviewers need only a corporate login and a URL. Commenting and annotating require no chart-building knowledge.

Build It With Andolasoft

Andolasoft designs and deploys governed, board-ready analytics platforms on Apache Superset for manufacturing and industrial companies. See our detailed Superset dashboard templates for manufacturing KPIs for an example. Our BI practice covers the full lifecycle: KPI modelling to global standards (ISO 22400, SCOR, GRI) and data modelling with conformed dimensions. It also includes department dashboards with direction-aware RAG scorecards, row-level security, and Single Sign-On. Folder navigation and the Apache Superset collaboration features covered above round out the platform. Because Superset is open source, the entire platform runs without per-seat licence fees. The investment goes into your KPIs, not licences.

If your leadership team is still waiting for month-end spreadsheets, talk to us. We will stand up a working demo on a representative dataset and walk your stakeholders through it. Then we’ll give you a clear, fixed-scope plan to production.
Must-Have Enterprise BI Features for Modern Applications

Enterprise software no longer competes on features alone. It competes on how fast decisions are made, how accurately performance is measured, and how quickly leaders can respond to change. That is exactly why enterprise BI has moved from a “nice-to-have” analytics layer to a core operating system for decision-making.

Today, every serious enterprise application — whether it is ERP, CRM, HRMS, FSM, construction management, or financial systems — must embed or integrate BI at its core.

However, not all analytics are created equal.

True enterprise BI is not about pretty dashboards. Instead, it is about governance, scale, trust, performance, security, and decision velocity. Therefore, choosing the right BI features is a strategic architecture decision, not a UI decision.

In this definitive guide, you will learn:

  • What enterprise BI really means in modern enterprises
  • Why basic reporting tools fail at scale
  • The must-have BI features for any serious enterprise application
  • How BI drives adoption, ROI, and competitive advantage
  • How to evaluate an BI platform properly

Let us begin with the fundamentals.

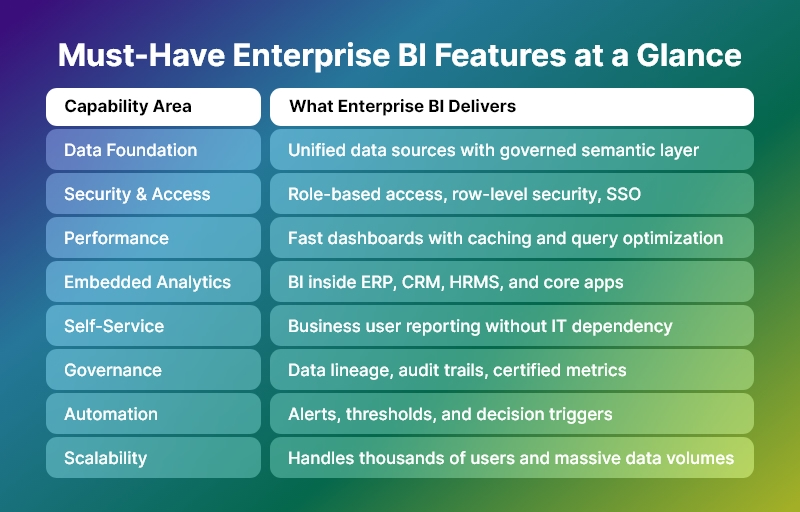
Must-Have-Enterprise-BI-Features-at-a-Glance

What Is Enterprise BI?

It (Enterprise Business Intelligence) is a scalable, governed, secure, and performance-driven analytics layer that supports decision-making across the entire organization—from frontline teams to executive leadership.

Unlike basic BI tools, enterprise BI:

  • Serves hundreds or thousands of users
  • Handles millions or billions of rows of data
  • Enforces data governance and security
  • Supports mission-critical business workflows
  • Integrates deeply into core enterprise applications

In other words, BI is not a reporting tool. It is a decision infrastructure.

Why Basic BI Fails in Enterprise Environments

Many organizations start with simple dashboards. However, they quickly hit limitations.

Basic BI fails because:

  • It cannot scale to large data volumes
  • It breaks under concurrent user load
  • It lacks role-based security and governance
  • It creates multiple versions of truth
  • It depends heavily on analysts instead of business users
  • It does not integrate deeply into enterprise workflows

As a result, enterprises either:

  • Lose trust in data
  • Slow down decision-making
  • Or build expensive, fragmented analytics stacks

This is exactly why enterprise BI exists.

The Strategic Role of Enterprise BI in Enterprise Applications

Modern enterprise applications are no longer transactional systems only. They are decision platforms.

Therefore, BI must:

  • Power daily operational decisions
  • Support strategic leadership decisions
  • Enable cross-department visibility
  • Drive process optimization
  • Enforce data accountability
  • Accelerate business execution

Consequently, BI becomes a core competitive advantage.

Must-Have Enterprise BI Features (Complete Enterprise Checklist)

Below is the definitive feature framework for evaluating or building a true BI system.

1. Enterprise-Grade Data Architecture

BI must handle complexity at scale.

It must support:

  • Multiple data sources (ERP, CRM, HRMS, IoT, Finance, Ops, external data)
  • Structured and semi-structured data
  • Large volumes and high refresh rates
  • Historical and real-time data together

Core capabilities include:

  • Data connectors and ingestion pipelines
  • Data modeling and semantic layers
  • Incremental refresh and caching
  • Support for cloud, on-prem, and hybrid data

Without this foundation, enterprise BI collapses under growth.

2. Single Source of Truth (Semantic Layer)

One of the biggest reasons BI fails is metric chaos.

Therefore, enterprise BI must provide:

  • Centralized metric definitions
  • Business-friendly semantic models
  • Reusable KPIs across dashboards and apps
  • Governance over calculations and logic

Benefits:

  • No conflicting numbers
  • No department-level data politics
  • No spreadsheet shadow systems
  • High trust in executive reporting

In short, BI must enforce truth at scale.

3. Enterprise Security and Access Control

Enterprise BI is useless if it is not secure.

It must support:

  • Role-based access control (RBAC)
  • Row-level and column-level security
  • SSO and enterprise authentication (SAML, OAuth, LDAP, etc.)
  • Audit logs and access tracking
  • Data masking for sensitive fields

Why this matters:

  • Finance, HR, and leadership data must not leak
  • Compliance requirements demand strict controls
  • Large organizations cannot rely on manual permissions

Therefore, security is not optional in BI. It is foundational.

4. Performance at Scale

Enterprise BI must stay fast even when:

  • Data grows 10x
  • Users grow 50x
  • Queries become complex
  • Dashboards become heavier

Critical performance features include:

  • Intelligent caching
  • Query optimization
  • In-memory acceleration
  • Pre-aggregations
  • Load balancing
  • Asynchronous query execution

Because in enterprises:

If dashboards are slow, decisions are slow. And slow decisions cost money.

5. Embedded Analytics for Enterprise Applications

Modern enterprise BI must not live in a separate portal.

Instead, it must:

  • Embed inside ERP, CRM, HRMS, FSM, or industry apps
  • Respect application user permissions
  • Adapt to application workflows
  • Feel like a native feature

Embedded BI enables:

  • Contextual decision-making
  • Higher adoption
  • Better user experience
  • Stronger product differentiation

Today, enterprise BI is a product feature, not a separate product.

6. Self-Service Analytics for Business Users

BI cannot depend entirely on analysts.

It must empower:

  • Managers
  • Operations leaders
  • Finance teams
  • Sales leaders
  • Department heads

Self-service features include:

  • Drag-and-drop reports
  • Filter and slice-and-dice
  • Drill-down and drill-through
  • Custom views and saved dashboards
  • Ad-hoc exploration without SQL

This ensures:

  • Faster answers
  • Less dependency on data teams
  • Higher data culture maturity

7. Advanced Dashboarding and Visualization

Enterprise BI dashboards must support:

  • Executive-level KPI views
  • Operational performance views
  • Departmental scorecards
  • Process monitoring screens

Core visualization capabilities:

  • Interactive charts and tables
  • Cross-filtering
  • Drill-down hierarchies
  • Conditional formatting
  • Alerts and thresholds
  • Storytelling views

However, remember:

Enterprise BI is not about visuals. It is about decisions enabled by visuals.

8. Real-Time and Near Real-Time Analytics

Many enterprise use cases require:

  • Live operations monitoring
  • SLA tracking
  • Incident detection
  • Financial risk control
  • Supply chain visibility

Therefore, BI should support:

  • Streaming or near-real-time data
  • Incremental refresh
  • Low-latency dashboards
  • Operational alerting

This transforms enterprise BI from reporting to control systems.

9. Alerts, Automation, and Decision Triggers

Modern BI must not wait for users to open dashboards.

It must:

  • Push alerts when thresholds are crossed
  • Trigger workflows
  • Send notifications to email, Slack, Teams, etc.
  • Integrate with business processes

Examples:

  • Alert when cash flow drops below limit
  • Alert when project cost overruns
  • Alert when churn risk spikes
  • When compliance metrics fail

This is how enterprise BI becomes proactive instead of reactive.

10. Data Governance and Lineage

At enterprise scale, governance is non-negotiable.

  • BI must provide:
  • Data lineage tracking
  • Impact analysis
  • Change management
  • Certification of datasets
  • Ownership and stewardship models

This ensures:

  • Audit readiness
  • Compliance confidence
  • Trust in enterprise-wide metrics
  • Controlled evolution of analytics

11. Collaboration and Sharing

Enterprise BI is a team sport.

It must support:

  • Shared dashboards
  • Commenting and annotations
  • Versioning
  • Scheduled reports
  • Role-based sharing

This transforms analytics into organizational conversation, not isolated analysis.

12. AI and Advanced Analytics (Optional but Strategic)

Modern enterprise BI increasingly includes:

  • Forecasting
  • Anomaly detection
  • Trend analysis
  • What-if simulations
  • Natural language queries

While not mandatory for every enterprise today, this is rapidly becoming a strategic differentiator.

13. Scalability and Future-Proof Architecture

Enterprise BI must scale across:

  • Users
  • Data volume
  • Use cases
  • Departments
  • Geographies

Therefore, it must support:

  • Modular architecture
  • API-first integration
  • Cloud and hybrid deployment
  • Horizontal scaling
  • Multi-tenant or multi-org setups

How Enterprise BI Drives Real Business Outcomes

When implemented correctly, BI delivers:

  • Faster decision cycles
  • Higher operational efficiency
  • Lower reporting overhead
  • Better leadership visibility
  • Stronger governance
  • Higher ROI from enterprise systems

In short:

BI turns data into organizational leverage.

How to Evaluate an Enterprise BI Platform

Use this checklist:

  • Does it scale to thousands of users?
  • Does it enforce governance and security?
  • Does it embed inside your application?
  • Does it support self-service safely?
  • Does it perform under heavy load?
  • Does it integrate with your data stack?
  • Does it reduce dependency on analysts?

If the answer is “no” to several of these, it is not true BI.

Final Thoughts: Enterprise BI Is Not Optional Anymore

In 2026 and beyond, BI is not an add-on.

It is:

  • A core layer of enterprise architecture
  • A strategic decision platform
  • A competitive advantage
  • A governance system
  • A performance engine

Organizations that treat BI as a strategic system will out-execute, out-learn, and out-scale those that do not.

And that is the real power of BI.