How To Slash Your BI Costs By 80% With Proven Open Source AI

The BI software market is dominated by a handful of legacy vendors — Tableau, Microsoft Power BI, Qlik, and SAP BusinessObjects — whose licensing models were designed for an era before cloud-native, AI-first alternatives existed. Today, these tools impose a heavy financial burden on growing businesses.

Consider the numbers. Tableau charges $70–$115 per user per month, which means a team of 50 analysts costs $42,000–$69,000 annually — just for the license. Add cloud hosting, professional services, and annual upgrades, and your total cost of ownership easily exceeds $200,000 per year. Qlik Sense follows a similar pattern, with enterprise contracts often exceeding $150,000 annually.

Beyond licensing, hidden costs compound the damage:

  • Vendor lock-in: Your data pipelines, dashboards, and reports are trapped inside proprietary formats. Switching costs are enormous.
  • Per-seat pricing traps: Every new analyst, manager, or stakeholder who needs access adds cost. Collaboration becomes expensive.
  • Slow upgrade cycles: New AI and ML features arrive on the vendor’s timeline, not yours. Competitive advantage erodes.
  • Professional services fees: Implementation, customization, and support add 30–50% to your annual spend.

The result? Many SMEs and project teams simply can’t afford the BI capabilities they need to compete. That’s where open source BI powered by AI changes everything.

What Are Open Source BI Tools and Why They Are Winning in 2026

Open source BI tools are analytics platforms where the source code is publicly available, community-maintained, and free to use. You pay only for hosting, support, and implementation — not for a per-seat license. This fundamentally flips the economics of business intelligence.

In 2026, open source BI is no longer a compromise. It is the preferred choice for forward-thinking organizations. According to Gartner’s 2025 Data & Analytics Survey, over 60% of mid-sized enterprises plan to adopt open source analytics platforms by 2027, driven by cost savings and AI integration capabilities.

The most powerful open source BI platforms today include:

  • Apache Superset — A modern, enterprise-grade BI platform with 50,000+ GitHub stars and native AI integrations.
  • Metabase — A beginner-friendly self-service analytics tool ideal for SME teams.
  • Grafana — Best-in-class for real-time monitoring dashboards and operational analytics.
  • Redash — A lightweight SQL-based reporting tool for data teams.
  • Apache Kylin — OLAP-on-Hadoop engine designed for petabyte-scale analytical queries.

Our expert team at Andolasoft helps businesses implement and scale these platforms as part of our Superset BI Services, combining open source power with enterprise-grade reliability and our AI Framework Services.

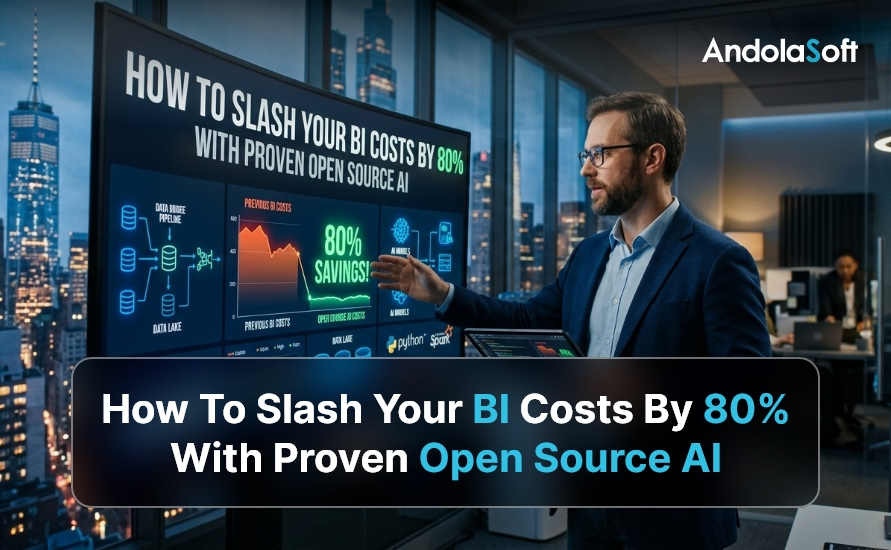
The 80% Cost Reduction: How the Math Works

Let’s be specific about the 80% savings figure, because vague claims help no one. Here is a real-world cost comparison for a 50-person analytics team:

Cost Component Tableau (Enterprise) Apache Superset (Open Source)
Annual License $69,000 $0
Cloud Hosting $24,000 $8,400 (managed cloud)
Implementation $35,000 $12,000 (one-time)
Annual Support $18,000 $6,000
Total Year 1 $146,000 $26,400
Savings $119,600 (82% reduction)

Beyond Year 1, savings accelerate further because you eliminate annual license renewals entirely. Over five years, this team saves over $500,000 — capital that can fund product development, sales, or hiring.

This is the power of open source data analytics. It doesn’t just save money — it fundamentally changes what’s financially possible for your business intelligence strategy.

Top 5 Open Source AI BI Tools That Deliver 80% Cost Savings

1. Apache Superset — The Enterprise-Grade Champion

Apache Superset is the most powerful open source BI tool available today. Originally built by Airbnb’s data engineering team and now an Apache Software Foundation top-level project, Superset supports over 40 database connectors, rich visualization libraries, and a no-code chart builder.

Key capabilities include SQL Lab for advanced querying, role-based access control for enterprise security, and seamless integration with Python-based AI/ML pipelines. Andolasoft’s Superset BI implementation services help you deploy, customize, and scale Superset for your specific industry needs. We also offer specialized loan analytics systems and loan monitoring solutions built on Superset for NBFC and BFSI clients.

2. Metabase — Self-Service Analytics for SMEs

Metabase democratizes data access. Its point-and-click interface allows non-technical business users to build reports and dashboards without writing SQL. For SMEs with limited data engineering resources, Metabase delivers extraordinary value at near-zero license cost.

3. Grafana — Real-Time Operational Dashboards

Grafana excels at time-series analytics and real-time monitoring. If your team needs live operational dashboards — tracking server performance, IoT sensor data, or financial transaction flows — Grafana is unmatched. Its plugin ecosystem and alerting capabilities make it a staple for DevOps and IT teams integrating with cloud infrastructure services.

4. Redash — SQL-Powered Reporting for Data Teams

Redash is purpose-built for data analysts who live in SQL. It supports 35+ data sources, collaborative query editing, and schedule-based report delivery. It’s lightweight, fast to deploy, and integrates cleanly with modern data stacks.

5. Apache Kylin — OLAP at Petabyte Scale

For organizations dealing with massive datasets — think large-scale BFSI data platforms or geo-spatial engineering datasets — Apache Kylin provides sub-second query responses on petabyte-scale data through pre-computed OLAP cubes. This is the tool for when speed and scale both matter.

How AI Is Supercharging Open Source BI in 2026

The most exciting development in open source BI is the rapid integration of artificial intelligence. Modern open source platforms now support AI capabilities that were exclusive to enterprise vendors just two years ago. This convergence of AI and open source BI is the defining trend of 2026.

Here’s how AI is transforming open source BI tools:

  • Natural Language Querying (NLQ): Ask your dashboard questions in plain English. AI translates your query into SQL and returns visualized results instantly. No SQL knowledge required.
  • Automated Anomaly Detection: AI monitors your data streams continuously and alerts you to unusual patterns before they become critical business problems.
  • Predictive Analytics: Integrate Python-based ML models directly into your BI dashboards for forward-looking insights, not just historical reporting.
  • AI-Powered Data Prep: Automated data cleaning, deduplication, and transformation reduce the manual effort of data engineering by up to 70%.
  • Smart Dashboard Recommendations: AI analyzes your data schema and usage patterns to suggest the most relevant visualizations for your business goals.

Andolasoft’s Autonomous AI Assistants and Intelligent Automation Services integrate seamlessly with open source BI platforms. We build AI layers on top of Apache Superset that give your team conversational analytics, predictive modeling, and automated reporting — all within the open source cost model.

Our AI Framework Services ensure that the AI models powering your BI platform are production-grade, explainable, and compliant with your industry’s regulatory requirements.

Real-World Use Cases: Open Source BI Delivering Results

NBFC & BFSI: Transforming Loan Portfolio Analytics

A mid-sized Non-Banking Financial Company (NBFC) was spending $180,000 annually on a legacy BI platform to monitor loan performance, NPA ratios, and collection efficiency. By migrating to Apache Superset with Andolasoft’s NBFC data analytics solutions, they reduced their annual BI spend to $28,000 — an 84% cost reduction — while gaining real-time loan monitoring dashboards and AI-powered early warning systems for default risk.

Similarly, our BFSI data analytics clients in the banking sector have used open source BI to build regulatory reporting dashboards, fraud detection visualizations, and customer segment analysis tools at a fraction of the cost of Bloomberg or Cognos platforms.

SME Manufacturing: Operational Intelligence on a Budget

A 200-employee manufacturing SME needed production floor analytics, inventory optimization dashboards, and sales performance reporting. Previously, this required an expensive ERP-bundled BI module. By deploying Metabase and Grafana on their existing cloud infrastructure through Andolasoft’s application modernization services, they built a fully integrated analytics stack for under $15,000 — saving $95,000 compared to their previous vendor quote.

SaaS Startup: Scaling Analytics Without Scaling Costs

A B2B SaaS startup needed product analytics, customer success dashboards, and ARR reporting for their investor board. Using Apache Superset integrated with their existing Python backend — built by Andolasoft’s Python development team — they deployed a full analytics platform in six weeks. Their total analytics infrastructure cost: $8,400 per year. The equivalent Tableau setup would have cost $65,000+.

Step-by-Step: How to Implement Open Source BI and Cut Costs by 80%

Transitioning to open source BI requires a structured approach to ensure you capture the full cost savings without disrupting business operations. Here is the proven implementation framework Andolasoft uses with clients:

Step 1: Audit Your Current BI Spend and Requirements

Document all existing BI tools, licenses, user counts, data sources, and use cases. Identify which reports are business-critical and which are never used. Most organizations discover that 40–60% of their BI license costs cover features nobody uses.

Step 2: Define Your Open Source BI Architecture

Choose your tool stack based on use case. Apache Superset works well as the primary analytics layer. Grafana handles real-time monitoring. Redash serves the SQL-heavy data engineering team. Our digital strategy and transformation team maps your requirements to the right open source stack.

Step 3: Select Your Cloud Infrastructure

Open source BI tools run on any cloud platform — AWS, GCP, Azure, or on-premise. Our cloud infrastructure services help you choose the most cost-effective deployment model and configure auto-scaling to match your usage patterns.

Step 4: Implement with Enterprise Security Standards

Open source doesn’t mean unsecured. Deploy role-based access control (RBAC), single sign-on (SSO), data encryption at rest and in transit, and audit logging from day one. Our enterprise IT security team ensures your open source BI platform meets SOC 2, ISO 27001, and industry-specific compliance requirements.

Step 5: Migrate Data Pipelines and Dashboards

Systematically migrate your most-used dashboards first. Our enterprise integration services team handles connector development, ETL pipeline migration, and data model translation from proprietary formats to open standards.

Step 6: Train Your Team and Drive Adoption

User adoption is the most common failure point in BI migrations. We provide structured training programs, self-service documentation, and hypercare support during the first 90 days. Our enterprise project management framework keeps migrations on schedule and within budget.

Step 7: Add AI Capabilities to Maximize ROI

Once the core platform is stable, layer in AI capabilities — natural language querying, predictive dashboards, and automated anomaly detection. Our Innovation & Product R&D team helps design AI features tailored to your industry’s analytical needs.

Governance, Compliance, and Data Quality in Open Source BI

One concern we hear frequently is: “Will open source BI meet our governance and compliance requirements?” The answer is yes — when implemented correctly. In fact, open source platforms often offer better governance transparency than proprietary tools because you can audit the underlying code.

Our digital governance solutions team implements data cataloging, lineage tracking, quality scorecards, and policy enforcement frameworks within Apache Superset. This gives compliance officers the visibility they need to meet GDPR, CCPA, RBI, and SEBI requirements.

For geo-spatial data analytics needs, our geo-spatial engineering services team integrates location intelligence layers into open source BI dashboards, delivering capabilities that cost $80,000+ in proprietary GIS platforms at a fraction of the price.

Additionally, our software quality assurance practice ensures that every BI dashboard, data pipeline, and AI model is rigorously tested before reaching business users.

Why Andolasoft Is Your Trusted Open Source BI Partner

Andolasoft has been delivering data and analytics solutions for over 15 years. Our team of 200+ engineers, data scientists, and BI specialists has implemented open source BI platforms across BFSI, manufacturing, healthcare, retail, and SaaS sectors. We don’t just deploy software — we build analytics ecosystems that drive measurable business outcomes.

Our Apache Superset BI Services cover the complete lifecycle: strategy, architecture, implementation, customization, AI integration, training, and ongoing managed support. We are an Apache Superset specialized partner with certified engineers and a portfolio of 50+ successful deployments.

We also build complementary solutions using ReactJS for custom dashboard front-ends and Python for data engineering, ML model serving, and API development — giving you a truly integrated, end-to-end analytics stack built on open standards.

Open Source BI vs. Proprietary BI: Head-to-Head Comparison (2026)

Feature Apache Superset (Open Source) Tableau (Proprietary) Power BI (Proprietary)
Annual License Cost (50 users) $0 $42,000–$69,000 $12,000–$60,000
AI/ML Integration Native Python/ML support Einstein AI (extra cost) Copilot (premium tier)
Customization Full source code access Limited APIs Limited
Data Connectors 40+ native connectors 70+ connectors 100+ connectors
Vendor Lock-in None High High (Microsoft ecosystem)
5-Year TCO (50 users) ~$130,000 ~$620,000 ~$380,000

The data speaks clearly. Open source BI tools deliver comparable or superior functionality at 80% lower total cost of ownership over a five-year period. The only question is how quickly you make the transition.

Conclusion: The Time to Cut Your BI Costs Is Now

The business intelligence landscape has permanently shifted. Open source AI-powered BI tools now offer capabilities that match or exceed legacy enterprise vendors — at 80% lower cost. The technology is mature, the community is vibrant, and the business case is overwhelming.

Every month you continue paying $50,000–$200,000+ in BI licensing fees is a month you’re choosing to subsidize software vendors instead of investing in your own growth. The SMEs and startups winning in 2026 have made the switch. They’re running Apache Superset, integrating AI analytics, and reinvesting their savings into product, people, and market expansion.

Andolasoft has the expertise, the certified engineers, and the proven methodology to make your open source BI migration smooth, fast, and successful. From Superset BI implementation to intelligent automation and AI-powered analytics, we help you build the analytics stack your business needs to compete and win.

The 80% savings aren’t theoretical — they’re waiting for you. The only question is: when will you claim them?

Frequently Asked Questions (FAQs)

1. What are open source BI tools?

Open source BI tools are business intelligence platforms whose source code is publicly available and free to use. Examples include Apache Superset, Metabase, Grafana, and Redash. You pay only for hosting, support, and implementation — not per-seat licenses.

2. Can open source BI tools really reduce costs by 80%?

Yes. The 80% reduction is achievable because you eliminate per-seat licensing fees, which typically represent 60–70% of total BI costs. Combined with efficient cloud hosting and one-time implementation costs, organizations consistently achieve 75–85% cost reductions compared to enterprise vendors like Tableau or Qlik.

3. Is Apache Superset suitable for enterprise use?

Absolutely. Apache Superset is used in production by companies including Airbnb, Twitter, Lyft, and Nielsen. It supports enterprise-grade features including RBAC, SSO, audit logging, and high-availability deployments at petabyte scale.

4. How long does it take to migrate from Tableau to Apache Superset?

A typical migration takes 6–16 weeks depending on the number of dashboards, data sources, and users involved. Andolasoft’s structured migration methodology has delivered migrations of 200+ dashboards in under 12 weeks for enterprise clients.

5. Does open source BI support AI and machine learning?

Yes. Apache Superset integrates natively with Python-based ML frameworks including scikit-learn, TensorFlow, and PyTorch. Natural language querying, predictive analytics, and automated anomaly detection can all be implemented within an open source BI stack.

6. What are the security risks of open source BI tools?

Open source BI tools are as secure as proprietary alternatives when properly configured. They support RBAC, SSO, data encryption, and audit logging. The open source model also allows independent security audits of the codebase — something proprietary vendors cannot offer.

7. Which industries benefit most from open source BI?

Open source BI delivers the most value in cost-sensitive industries: BFSI, NBFC, healthcare, manufacturing, retail, and SaaS. Any organization with 20+ analytics users and significant BI licensing costs will see substantial savings.

8. What support is available for open source BI tools?

Support options include vibrant community forums, commercial support contracts from specialist vendors like Andolasoft, and managed service arrangements. Commercial support costs are typically 80–90% lower than proprietary vendor support contracts.

9. How does Andolasoft help with open source BI implementation?

Andolasoft provides end-to-end open source BI services: strategy, architecture design, Apache Superset implementation, AI integration, dashboard migration, user training, and ongoing managed support. We have delivered 50+ successful open source BI projects across 12 countries.

10. Can I try open source BI before committing to a full migration?

Yes. Andolasoft offers a proof-of-concept engagement where we deploy Apache Superset with your existing data sources and build 3–5 key dashboards in four weeks.

Unlock Amazing BI Savings With Apache Superset in 2026 Today

Every dollar counts when you run a startup or SME. Yet most companies waste $50,000 to $120,000 per year on business intelligence (BI) tools they barely use. However, there is a smarter way in 2026 — and it costs almost nothing to start. Apache Superset BI savings are real. Apache Superset is the world’s most popular open-source BI platform, trusted by Airbnb, Nielsen, and thousands of fast-growing companies. Moreover, it gives your team powerful dashboards, deep analytics, and stunning data visualization — without the enterprise price tag that breaks budgets.

In this guide, you will discover exactly how Apache Superset delivers massive BI savings. You will also learn which features make it the best choice in 2026. Additionally, see how Andolasoft’s Superset BI Services help you unlock those savings faster than ever before.

What Is Apache Superset and Why It Matters in 2026

Apache Superset is a modern, open-source BI platform. It was originally developed by Airbnb and later donated to the Apache Software Foundation. Therefore, the software is completely free to use under the Apache 2.0 license.

In 2026, the BI software market will reach $33.3 billion (Gartner). However, most of that spend goes to licensing fees — not actual insights. Apache Superset flips this model. You pay for infrastructure only, not software. As a result, your budget goes toward real analytics value.

At Andolasoft, our Superset BI Services team has deployed Apache Superset for clients across NBFC, BFSI, retail, and SaaS sectors. Furthermore, we consistently see companies slash their BI spend by 60% to 80% within the first year of migration.

Key Facts About Apache Superset

  • Over 50,000+ GitHub stars — one of the most loved open-source BI projects globally
  • Connects to 40+ databases including PostgreSQL, MySQL, BigQuery, Snowflake, and Redshift
  • Fully REST API-enabled for seamless integration with your existing tech stack
  • Built-in SQL Lab lets teams write complex queries without a separate database tool
  • Supports role-based access control (RBAC) to protect sensitive business data

The Real Cost of Traditional BI Tools in 2026

Most organizations do not realize how much they overpay for BI. Let’s look at the hard numbers hurting your bottom line right now.

Tableau charges $70–$115 per user per month. For a 50-person team, that is $42,000–$69,000 per year. Importantly, this does not include training, implementation, or support costs. Power BI is cheaper, however it locks you into the Microsoft Azure ecosystem at $10–$20 per user per month.

Beyond licensing, traditional BI platforms create hidden costs that compound quickly. These include vendor lock-in, expensive consultants for customization, and complex pricing tiers that punish growth. Therefore, switching to Apache Superset is a straightforward decision for most SMEs.

💡 Real Cost Impact: A 50-person team on Tableau spends up to $69,000/year on licensing alone. Switching to Apache Superset with managed hosting reduces this to just $3,000–$8,000/year. That is a saving of up to $61,000 annually.

Furthermore, traditional tools require specialized consultants just to build basic reports. In contrast, our Data Analytics services team enables your internal users to self-serve insights — eliminating costly dependency on outside experts.

How Apache Superset Delivers Massive BI Savings

Apache Superset does not just replace expensive BI tools. It actively creates financial advantages across your entire data operation. Here is how the savings stack up.

Zero Licensing Costs

Apache Superset is 100% open-source under the Apache 2.0 license. You pay nothing for the software itself. Consequently, your only costs are cloud hosting and optional expert implementation — both a fraction of traditional licensing fees.

Reduced Vendor Lock-In

Because Superset is open-source and database-agnostic, you are never trapped with one vendor. If you switch from MySQL to Snowflake, your dashboards follow seamlessly. Moreover, this flexibility pairs beautifully with our Cloud & Infrastructure Services, where we help you build portable, cost-efficient data pipelines.

Faster Time-to-Insight

Traditional BI implementations take 6–12 months. They also cost $80,000–$200,000 in professional services. However, a managed Apache Superset deployment with Andolasoft launches in just 4–8 weeks. This cuts time-to-value by up to 70%.

Self-Service Analytics

Superset empowers business users — not just data engineers — to build their own dashboards. This dramatically reduces analyst workload. Additionally, combined with Intelligent Automation, teams can schedule automated reports and alerts without ongoing manual effort.

Top 7 Ways Apache Superset Cuts Your BI Budget in 2026

Here are the seven proven ways Apache Superset delivers measurable cost savings for SMEs and startups.

  • Eliminates Software Licensing: No per-seat fees exist. There are zero annual license renewals. Your entire organization can access Superset simultaneously at no extra cost.
  • Reduces Infrastructure Costs: Superset runs efficiently on cloud instances from just $200–$500/month for most SMEs. This compares to $4,000–$8,000/month for enterprise BI SaaS plans.
  • Cuts Consultant Dependency: Superset’s intuitive drag-and-drop interface means business analysts build dashboards independently. As a result, costly consultant hours reduce by up to 60%.
  • Accelerates Data-Driven Decisions: Faster insights mean faster pivots. Companies using Superset report 35% faster decision cycles. This directly translates to measurable revenue impact.
  • Integrates With Existing Tools: Superset connects natively to your Python stack, React frontend, and existing databases. Specifically, our Python Development team optimizes these integrations for peak performance.
  • Enables Unlimited Users: Unlike Tableau’s per-seat pricing, Superset scales to any team size at no additional cost. Therefore, adding 100 new users costs the same as adding 10.
  • Powers Financial Analytics: For NBFC and BFSI sectors, Superset powers specialized use cases like our Loan Analytics System and Loan Monitoring System — replacing expensive proprietary financial BI tools entirely.

Apache Superset vs. Tableau vs. Power BI — 2026 Cost Comparison

Numbers speak louder than claims. Here is how Apache Superset compares against Tableau and Power BI on the metrics that matter most to budget-conscious teams in 2026.

Feature Apache Superset Tableau Power BI
License Cost Free (Open-Source) $70–$115/user/mo $10–$20/user/mo
Annual Cost (50 Users) ~$0 (hosting only) $42,000–$69,000 $6,000–$12,000
Cloud Hosting Any cloud provider Tableau Cloud only Azure only
Custom Dashboards Unlimited Limited Limited
SQL Editor Built-in Yes Not included Partial
Open-Source Apache 2.0 Proprietary Proprietary
Vendor Lock-in None High Medium

The verdict is clear. Apache Superset delivers enterprise-grade BI at a fraction of the cost. Moreover, for BFSI and NBFC organizations, the advantage is especially strong. Our specialized BFSI Data Analytics and NBFC Data Analytics solutions show exactly how industry-specific Superset deployments maximize this advantage.

Real-World Use Cases: Companies Saving Big With Apache Superset

Theory is useful. However, real results build conviction. Here are three organizations achieving meaningful BI savings with Apache Superset right now.

Use Case 1: NBFC Company Cuts Reporting Costs by 72%

A mid-sized NBFC was spending $84,000 per year on a proprietary loan reporting platform. After Andolasoft migrated them to Apache Superset — integrated with our NBFC Data Analytics framework — their annual BI cost dropped to $23,500. That is a saving of $60,500 per year. Additionally, they gained better dashboard performance and real-time loan monitoring.

Use Case 2: SaaS Startup Achieves BI in 5 Weeks

A SaaS company needed investor-ready dashboards but had no BI budget. Using Andolasoft’s Superset BI Services and our ReactJS Development team, they launched a full BI layer in just 5 weeks for under $12,000. In comparison, a Tableau implementation quote from another vendor had come in at $95,000.

Use Case 3: Enterprise Team Consolidates 6 Tools Into 1

An enterprise project management team was juggling six separate reporting tools. Our Enterprise Project Management solution consolidated all reporting into a single Superset instance. As a result, they achieved a 68% reduction in reporting overhead and 40% faster team reporting cycles.

How Andolasoft’s Superset BI Services Maximize Your ROI

Implementing Apache Superset correctly is the difference between transformational savings and a frustrating half-deployed tool. Therefore, Andolasoft’s Superset BI Services provide end-to-end expertise — from architecture design to dashboard delivery — so you realize full ROI from day one.

  • Application Modernization: We modernize legacy reporting systems before migrating to Superset. Consequently, you get zero data loss and a smooth, risk-free transition.
  • AI Framework Services: We integrate machine learning models into your Superset dashboards. This enables predictive analytics alongside standard reporting.
  • Digital Strategy & Transformation: We align your Superset implementation with your broader digital roadmap. As a result, you maximize long-term data ROI.
  • Enterprise Integration: We connect Superset to your ERP, CRM, and operational databases using industry-standard integration patterns.
  • Digital Governance Solutions: We ensure your Superset implementation meets regulatory and compliance standards — especially critical in BFSI and healthcare sectors.

For project teams, tools like OrangeScrum pair powerfully with Superset dashboards. Together, they connect project data directly to business analytics, building integrated and cost-efficient operations.

Key Features That Make Apache Superset the Best BI Choice in 2026

Apache Superset is not just affordable. It is genuinely powerful. Here are the features that make it the smartest BI investment for any SME or startup in 2026.

Rich Chart Library

Superset ships with 40+ chart types — from bar charts and heat maps to advanced funnel charts and geospatial visualizations. Furthermore, our Geo-Spatial Engineering & Services team extends these capabilities with custom map layers for logistics and field operations.

SQL Lab for Power Users

Business analysts and data engineers love Superset’s built-in SQL Lab. It supports multi-tab querying, query history, auto-complete, and results download. Therefore, teams no longer need separate database GUI tools.

Role-Based Access Control

Superset’s enterprise-grade RBAC ensures each user sees only the data they are authorized to view. This is critical for Digital Governance Solutions compliance — particularly in regulated sectors like banking and healthcare.

Embedded Analytics

Superset dashboards embed directly into your product or customer portal via its REST API. Combined with Andolasoft’s ReactJS Development expertise, we build seamless embedded analytics experiences that differentiate your product.

Autonomous AI Assistant Integration

In 2026, Superset integrates powerfully with Autonomous AI Assistants to enable natural language querying. Users simply type a question and get instant answers — no SQL knowledge required.

Step-by-Step: Getting Started With Apache Superset

Ready to deploy Apache Superset? Here is the practical 7-step path to your first dashboard and your first BI savings.

  • Audit Your Current BI Stack: Document all existing BI tools, their costs, and actual usage rates. Most teams discover 40% of their BI seats are unused.
  • Define Dashboard Requirements: Identify the 5–10 most critical dashboards your team uses daily. These become your migration priority.
  • Choose Your Cloud Infrastructure: Select a cloud provider for Superset hosting. AWS, GCP, and Azure all work excellently. Our team right-sizes your environment for cost efficiency.
  • Connect Your Data Sources: Use Superset’s connection wizard to link your existing databases and data warehouses in minutes.
  • Build Your Dashboards: Use Superset’s drag-and-drop chart builder to recreate critical dashboards — or let Andolasoft’s team handle it for you.
  • Train Your Team: Superset’s learning curve is gentle. Most business users become productive within 2–3 hours of training.
  • Monitor and Optimize: Use Superset’s built-in query performance metrics to identify slow dashboards and optimize your data models over time.

For payroll-linked analytics in workforce planning, consider pairing Superset with IndPayroll — enabling seamless HR cost reporting directly within your BI dashboards.

The Future of BI Savings: What’s Coming After 2026

Apache Superset continues to evolve rapidly. The 2026 roadmap includes native AI-powered chart recommendations, enhanced Innovation & Product R&D integrations, and improved real-time streaming dashboard support. Therefore, the cost-savings case for Apache Superset will only strengthen over time.

Additionally, as Shopify eCommerce Solutions grow in sophistication, Superset becomes the natural analytics layer for e-commerce operators. Consequently, businesses understand customer behavior, inventory trends, and campaign performance — all without paying premium analytics fees.

Furthermore, teams using our Software Quality Assurance services alongside Apache Superset benefit from rigorous testing of every dashboard. This ensures data accuracy and builds trust across your entire organization.

Conclusion: Your Apache Superset BI Savings Start Today

The evidence is clear. Apache Superset delivers enterprise-grade BI at open-source prices. For SMEs, startups, and project teams, this is one of the highest-ROI technology decisions available in 2026. Therefore, now is the perfect time to make the switch.

You do not need a million-dollar budget to have million-dollar data insights. Apache Superset — expertly implemented by Andolasoft — gives your team the analytical power to compete at the highest level. Moreover, you will spend a fraction of what your competitors pay for legacy BI tools.

Explore our full range of Superset BI Services and read more expert guides on our Andolasoft Blog. Your journey to smarter, leaner BI starts now. Additionally, explore CRMLeaf to see how data-driven CRM integrates seamlessly with your new BI strategy.

Frequently Asked Questions About Apache Superset BI Savings

1. What is Apache Superset and how does it save money?

Apache Superset is a free, open-source BI platform. It replaces costly tools like Tableau and Power BI. Since the software itself is free, your only costs are hosting and optional implementation. As a result, SMEs typically save $30,000–$60,000 per year compared to enterprise BI licensing.

2. Is Apache Superset suitable for small businesses?

Absolutely. Apache Superset is ideal for small and medium businesses precisely because it scales efficiently. You can start with a minimal cloud instance for under $200 per month. Furthermore, you scale only as your data needs grow — with zero increase in licensing costs.

3. How does Apache Superset compare to Power BI in 2026?

Apache Superset is completely free, while Power BI costs $10–$20 per user per month. Superset is also database-agnostic — it is not locked to Azure. Additionally, it supports embedded analytics more flexibly and includes a built-in SQL editor that Power BI lacks.

4. Can Apache Superset connect to my existing databases?

Yes. Apache Superset connects to 40+ data sources out of the box. These include PostgreSQL, MySQL, Snowflake, BigQuery, Redshift, and SQL Server. Moreover, Andolasoft’s team can build custom connectors for proprietary or legacy systems when needed.

5. How long does it take to deploy Apache Superset?

A standard Apache Superset deployment by Andolasoft takes 4–8 weeks from kickoff to go-live. This includes infrastructure setup, database connections, initial dashboard migration, and team training. Therefore, you get value significantly faster than traditional enterprise BI implementations.

6. Is Apache Superset secure enough for financial data?

Yes. Apache Superset includes enterprise-grade RBAC, SSL/TLS encryption, and audit logging. Furthermore, Andolasoft’s implementations — backed by our Enterprise IT Security services — add additional security hardening aligned with banking and financial services compliance requirements. Consequently, your sensitive data stays fully protected.

7. Do I need a dedicated data engineering team to use Superset?

No. While a data engineer is helpful for initial setup, Superset’s business-user-friendly interface allows analysts and non-technical managers to build dashboards independently. Additionally, Andolasoft provides training to ensure your team becomes self-sufficient quickly.

8. Can Apache Superset handle real-time data?

Yes. Apache Superset supports real-time and near-real-time dashboard refresh rates depending on your data source configuration. For streaming use cases, Andolasoft integrates Superset with Apache Kafka or similar streaming platforms. As a result, you get live operational dashboards when you need them.

9. What industries benefit most from Apache Superset BI savings?

Apache Superset delivers particularly strong ROI in NBFC, BFSI, SaaS, retail, healthcare, logistics, and manufacturing sectors. However, any industry with high data volume and a need for cost-efficient reporting can benefit enormously from a well-implemented Apache Superset solution.

10. How do I get started with Andolasoft’s Apache Superset services?

Getting started is simple. Visit Andolasoft‘s Superset BI Services page to explore our implementation packages. Alternatively, sign up for a free CRMLeaf trial to experience data-driven business management firsthand. Our team is ready to help you design the optimal Superset solution for your specific goals and budget.

Apache Superset vs Power BI: Which Wins in 2026?

Introduction

The Apache Superset vs Power BI debate has become one of the most consequential decisions in the business intelligence landscape in 2026. Data teams are under pressure to deliver faster insights, cut tool costs, and integrate AI-driven analytics into their workflows. At the center of that debate, two platforms consistently dominate the conversation: Apache Superset and Microsoft Power BI.

Both tools can visualize data beautifully. Both serve large enterprises. But they are built on fundamentally different philosophies, and choosing the wrong one for your organization can cost you months of migration pain and hundreds of thousands of dollars in licensing.

At Andolasoft, our engineering teams have deployed and managed both platforms across industries — from fintech and pharma to construction and retail. We’ve helped clients like Arvest Bank, Aurobindo Pharma, and Bosch make this exact decision. This comparison is not theoretical. It’s drawn from real implementations, real migrations, and real performance benchmarks across production environments.

Whether you’re evaluating your first BI platform or reconsidering an existing investment, this guide gives you the definitive Apache Superset vs Power BI answer for 2026.

What Is Apache Superset?

Apache Superset is a modern, open-source data analytics and business intelligence platform developed at Airbnb and now maintained under the Apache Software Foundation. It is written in Python with a React-based frontend, and is designed to connect directly to your existing SQL databases and data warehouses — no proprietary data layer required.

Superset supports a wide range of chart types, including bar charts, line charts, heatmaps, geospatial maps, and time-series visualizations. It features SQL Lab, a powerful in-browser SQL IDE, and a no-code chart builder for analysts who prefer a visual interface. It is cloud-native and designed to run on Kubernetes or Docker in environments you fully control.

What Is Microsoft Power BI?

Microsoft Power BI is a cloud-hosted, SaaS-based BI and reporting platform that is deeply integrated with the Microsoft 365 ecosystem — Azure, Excel, Teams, SharePoint, and the broader Power Platform. It offers a rich desktop authoring experience (Power BI Desktop), a cloud-hosted service (Power BI Service), and an embedded analytics SDK for developers.

Power BI’s low barrier to entry, intuitive drag-and-drop interface, and deep Microsoft ecosystem integration have made it one of the most widely adopted BI tools globally, especially in enterprises already running on Azure and Office 365.

Apache Superset vs Power BI: Head-to-Head Comparison

1. Cost and Licensing

This is often the deciding factor for growing organizations comparing Apache Superset vs Power BI.

Power BI uses a per-user SaaS pricing model. Power BI Pro costs approximately $10 per user per month, while Power BI Premium Per User (PPU) runs around $20 per user per month. For larger deployments needing Premium capacity, costs scale sharply — Premium capacity nodes start at several thousand dollars per month.

Apache Superset is free and open source under the Apache 2.0 license. Your only costs are the cloud infrastructure you choose to run it on — typically an AWS EC2 instance, a managed PostgreSQL database (Amazon RDS), and Redis for caching. For most mid-sized teams, this translates to $50–$300/month in infrastructure costs, regardless of how many users access the platform.

See how one of our clients cut their BI bill by 83% using Apache Superset — a real-world case study that shows the cost advantage in action.

Winner: Apache Superset — for cost-conscious organizations and teams scaling beyond 50+ users, the savings are substantial and compounding.

2. Ease of Use and Learning Curve

Power BI wins here for non-technical users. Its drag-and-drop report builder, Excel-like DAX formula language, and extensive Microsoft documentation make it accessible to business analysts with minimal technical training. The Power BI Desktop application is polished and intuitive.

Apache Superset has a steeper initial learning curve, particularly for organizations without internal DevOps capability. Setting up a Superset deployment requires Linux, Docker, Python, and SQL familiarity. However, once deployed, its SQL Lab, no-code chart builder, and dashboard interface are straightforward for analysts to use day-to-day.

Winner: Power BI — for business-led, low-code teams. Superset for technically mature data organizations.

3. Data Source Connectivity

Apache Superset supports over 40 database connections via SQLAlchemy and Apache Arrow Flight SQL, including every major cloud data warehouse and OLAP engine. It is database-agnostic by design. You can query Amazon Redshift, Snowflake, Databricks, Apache Druid, and Trino from the same interface without any data movement.

Power BI offers hundreds of built-in connectors through its proprietary Power Query engine. However, many connectors require Premium licensing to use in production at scale, and connecting to non-Microsoft data sources often requires additional configuration or gateways.

Learn more about must-have enterprise BI features that modern applications require for seamless data source connectivity.

Winner: Apache Superset — for multi-cloud, polyglot data environments. Power BI for Microsoft-first ecosystems.

4. Performance and Scalability

Apache Superset is a query engine-agnostic visualization layer. It pushes computation directly to your underlying data warehouse — Druid, ClickHouse, BigQuery, Redshift — and leverages those engines’ native optimization capabilities. It can scale horizontally on Kubernetes or vertically on larger EC2 instances based on demand. Andolasoft has deployed Superset environments serving hundreds of concurrent users across financial dashboards with no degradation.

Power BI scales well within the Microsoft ecosystem, but Premium capacity constraints can create bottlenecks during high-concurrency usage peaks. Organizations using Power BI’s shared capacity tiers often encounter report refresh rate limits and query throttling at scale.

If you’re evaluating why companies are migrating to cloud-based BI in 2026, scalability is consistently one of the top drivers.

Winner: Apache Superset — for high-concurrency, large-scale analytical workloads.

5. Customization and Extensibility

Apache Superset is fully open source and built on standard web technologies. Your team can contribute custom visualization plugins written in React, build custom authentication backends (LDAP, SAML, OAuth2), extend the API, and white-label the entire interface. Everything is customizable because everything is yours.

Power BI offers some customization via custom visuals (built with the Power BI Visuals SDK) and embedded analytics. However, you are always operating within boundaries set by Microsoft. You cannot customize the core application, alter the branding beyond limited options, or self-host the full Power BI service.

Explore how organizations are leveraging Superset for scalable and customizable data analytics across different industry verticals.

Winner: Apache Superset — for teams that need bespoke visualizations, white-labeling, or deep platform integration.

6. AI and Machine Learning Integration

Power BI has accelerated its AI roadmap through Microsoft Copilot integration, allowing users to generate reports, write DAX measures, and summarize dashboards using natural language prompts directly inside the Power BI interface. For organizations already in the Microsoft 365 ecosystem, this is a genuine productivity accelerator.

Apache Superset does not ship with built-in LLM features out of the box, but its open API architecture means your engineering team can integrate any AI layer — OpenAI, Anthropic, or a self-hosted LLM — directly into the platform. At Andolasoft, we have built custom NL-to-SQL query assistants on top of Superset deployments, allowing analysts to query dashboards in plain English with responses grounded in live warehouse data.

Predictive BI capabilities are increasingly important in 2026 — discover how modern platforms transform raw data into forward-looking insights.

Winner: Power BI out of the box for non-technical Copilot users. Apache Superset for organizations that want full control over their AI integration stack.

7. Security, Governance, and Data Residency

Apache Superset runs entirely within your own infrastructure — your VPC, your network, your encryption keys. Data never leaves your environment. For regulated industries (healthcare, banking, defense), this is not just a preference — it is a compliance requirement. Superset supports Row-Level Security (RLS), OAuth2, SAML, LDAP, and full audit logging.

Power BI is a SaaS product hosted on Microsoft’s Azure infrastructure. While Microsoft holds robust certifications (ISO 27001, SOC 2, HIPAA BAA), enterprise data still flows through and is processed on Microsoft servers. Organizations with strict data residency laws or air-gapped environments face real challenges with this model.

Review our guide on data governance and security best practices for Superset deployments to understand how to implement enterprise-grade controls.

For a broader overview of data governance practices for reliable BI insights, explore how leading organizations structure their governance frameworks.

Winner: Apache Superset — for data privacy, residency compliance, and regulated industries.

Apache Superset vs Power BI: Summary Comparison Table

Criteria Apache Superset Power BI
Cost Free (open source) $10–$20+/user/month
Ease of Use Technical teams Business users
Data Sources 40+ via SQLAlchemy Hundreds (some Premium)
Scalability Horizontal, Kubernetes-native Premium capacity limits
Customization Fully open, white-label Limited, Microsoft-controlled
AI Integration Custom LLM via open API Copilot (Microsoft 365)
Security Self-hosted, full control Azure-hosted SaaS

Who Should Choose Apache Superset?

Choose Superset if you have an engineering team comfortable with Python/Docker, need to control infrastructure and data residency, want to avoid per-user licensing at scale, need to embed analytics directly into a SaaS product, or are building on a multi-cloud or hybrid data stack.

Companies evaluating top embedded BI platforms for SaaS companies consistently find that Superset’s open architecture and white-labeling capabilities make it the preferred choice.

The role of embedded BI in enhancing SaaS products has grown significantly — Superset’s open-source model gives SaaS builders complete control over their analytics experience.

Who Should Choose Power BI?

Choose Power BI if your organization is already deeply invested in Microsoft 365 and Azure, your analysts are non-technical business users, you need rapid time-to-insight without infrastructure management, or you want Copilot-assisted reporting out of the box.

Understanding the top BI implementation mistakes before you commit to either platform can save your team significant time and resources during rollout.

For an unbiased industry perspective, the Gartner Magic Quadrant for Analytics and BI Platforms provides a useful benchmarking framework when evaluating both tools.

How Does Andolasoft Help with Apache Superset vs Power BI?

At Andolasoft, our Apache Superset BI Services help organizations evaluate, deploy, and scale both platforms based on their unique technical requirements, compliance needs, and team capabilities.

We’ve seen firsthand how Apache Superset, when deployed and configured correctly, outperforms Power BI on cost, scalability, data privacy, and long-term flexibility for almost every technically capable team. The perceived complexity of Superset is a deployment and operations problem — one that a specialized partner can solve in days, not months.

That is exactly what Andolasoft’s Apache Superset BI practice does. From initial architecture to production deployment, custom visualization plugins to enterprise RBAC configuration, we handle the complexity so your analysts can focus on insights.

If you’re still comparing options, our in-depth guide on Apache Superset vs Power BI vs Tableau provides a three-way enterprise comparison to help you finalize your decision.

You can also explore Apache Superset vs Tableau: 2026 Full Comparison and learn what makes Superset stand out from other BI tools on the market today.

Ready to evaluate Apache Superset for your organization? Talk to our data engineering team for a free architecture consultation.

BI and AI Explained: Turning Business Data into Predictive Intelligence

In today’s digital-first economy, data is no longer the differentiator — predictive intelligence is. Organizations generate massive volumes of data every day, yet many still struggle to turn that data into timely, actionable insights.

Traditional dashboards explain what happened, but modern businesses need answers to what will happen next. This is exactly where BI and AI come into play.

By combining Business Intelligence (BI) with Artificial Intelligence (AI), organizations can move beyond static reporting and unlock predictive intelligence — insights that anticipate trends, forecast outcomes, and recommend actions before problems arise.

As competition intensifies and decision cycles shorten, this capability has become mission-critical.

In this guide, you will learn how BI and AI works together, why it matters across industries, and how businesses can implement it successfully.

More importantly, you will see how Andolasoft helps organizations design, build, and scale predictive intelligence in data platforms that deliver real business outcomes — not just charts and dashboards.

Business intelligence and Artificial Intelligence Capabilities

Business Need & Importance of BI and AI

Modern businesses operate in environments defined by speed, complexity, and uncertainty. Customer expectations change rapidly, markets fluctuate, and operational risks emerge without warning.

In this context, relying on historical reports alone creates blind spots.

Why BI and AI Matters Today

BI and AI matters because it converts raw data into foresight. While BI organizes and visualizes structured data, AI analyzes patterns, learns from historical behavior, and predicts future outcomes. Together, they enable smarter, faster, and more confident decision-making.

Key business drivers include:

  • Exploding data volumes: Data from apps, IoT devices, CRMs, ERPs, and customer interactions is growing exponentially. Manual analysis simply cannot keep up.
  • Demand for real-time decisions: Leaders need insights now, not at the end of the month or quarter.
  • Competitive pressure: Companies that predict customer needs and operational risks earlier gain a clear advantage.

Industry-Specific Impact of BI and AI

Across industries, BI and AI is transforming how decisions are made:

  • Healthcare: Predictive analytics helps forecast patient admissions, detect anomalies in diagnostics, and optimize resource allocation.
  • eCommerce: AI-powered BI predicts demand, personalizes recommendations, and reduces cart abandonment through behavioral insights.
  • Logistics & Supply Chain: Companies forecast delays, optimize routes, and proactively manage inventory risks.
  • Fintech: Fraud detection models and credit risk predictions enhance security and regulatory compliance.
  • SaaS & Technology: Usage analytics and churn prediction enable proactive customer retention strategies.
  • Manufacturing: Predictive maintenance reduces downtime by identifying equipment failures before they occur.

Risks of Not Adopting BI and AI

Organizations that delay adoption face serious consequences:

  • Operational inefficiencies due to reactive decision-making
  • Revenue loss from missed opportunities and late responses
  • Security and compliance risks caused by delayed anomaly detection
  • Poor customer experience driven by generic, non-personalized interactions

Therefore, companies increasingly require strategic, scalable BI and AI solutions, not fragmented tools or legacy systems that fail to evolve with business needs.

Best Practices, Frameworks & Actionable Tips for BI and AI Implementation

Successfully implementing BI and AI requires more than tools — it demands the right strategy, architecture, and execution partner.

1. Start with Business Questions, Not Data

Successful BI and AI initiatives begin with clear business objectives. Instead of asking what data is available, define what decisions need improvement.

  • Identify high-impact use cases such as demand forecasting, churn prediction, or operational risk analysis.
  • Align analytics outputs directly with KPIs that leadership cares about.
  • Avoid building dashboards without a clear decision-making purpose.

2. Build a Strong Data Foundation

AI is only as good as the data it learns from. Data quality, consistency, and governance are non-negotiable.

  • Consolidate data from multiple sources into a centralized data warehouse or lake.
  • Standardize data definitions to eliminate reporting inconsistencies.
  • Implement strong data governance and access controls from day one.

3. Use the Right Architecture

A modern BI and AI architecture typically includes:

  • Data ingestion pipelines for real-time and batch data
  • Cloud-based data storage for scalability and performance
  • BI visualization layers for descriptive and diagnostic analytics
  • AI/ML models for predictive and prescriptive insights

This modular approach ensures flexibility as business needs evolve.

4. Combine Descriptive, Predictive, and Prescriptive Analytics

BI and AI works best when analytics maturity progresses in stages:

  • Descriptive analytics explains what happened.
  • Predictive analytics forecasts what will happen.
  • Prescriptive analytics recommends what actions to take next.

Skipping stages often leads to low adoption and mistrust in AI outputs.

5. Focus on Explainability and Trust

Business users must trust AI-generated insights.

  • Use explainable AI models where possible.
  • Clearly show which factors influenced predictions.
  • Provide confidence scores and scenario comparisons within dashboards.

6. Avoid Common BI and AI Mistakes

Common pitfalls include:

  • Treating AI as a plug-and-play feature rather than a continuous learning system.
  • Overengineering solutions before validating business value.
  • Ignoring change management and user adoption.

7. Quick Wins to Build Momentum

Low-effort, high-impact improvements include:

  • Automating anomaly detection in existing BI dashboards.
  • Adding predictive forecasts to sales and demand reports.
  • Using AI to prioritize leads or support tickets.

How Andolasoft Helps Implement BI and AI

Andolasoft delivers end-to-end BI and AI solutions tailored to business goals, not generic templates. Their expertise spans:

  • Custom Web Development for analytics platforms
  • SaaS Product Engineering with embedded BI and AI capabilities
  • BI, AI & Machine Learning Solutions for predictive intelligence
  • Data Analytics & Visualization for executive decision-making
  • Application Modernization to upgrade legacy BI systems
  • DevOps, Cloud & Automation for scalable, secure deployments

Choosing the right technology partner ensures long-term scalability, security, and ROI from BI and AI investments.

Customer Success Example: BI and AI in Action

For example, a mid-sized eCommerce company partnered with Andolasoft to modernize its analytics and forecasting capabilities. The company struggled with inventory overstocking, frequent stockouts, and delayed reporting that limited proactive decisions.

Andolasoft designed a BI and AI-driven predictive analytics platform that unified sales, customer behavior, and supply chain data into a single predictive intelligence layer. AI models were implemented to forecast product demand, identify high-risk SKUs, and recommend replenishment actions.

Within six months, the results were measurable:

  • 30% improvement in demand forecast accuracy
  • 25% reduction in inventory holding costs
  • 40% faster reporting cycles
  • Significantly improved executive visibility into future trends

Most importantly, decision-making shifted from reactive firefighting to predictive, data-driven planning.

Key Takeaways & Closing

To summarize, BI and AI represents a fundamental shift in how organizations use data:

  • BI provides clarity, while AI delivers foresight
  • Together, they enable predictive intelligence, not just reporting
  • Businesses across industries gain faster decisions, lower risk, and higher efficiency
  • Success depends on strategy, data quality, architecture, and execution

Adopting BI and AI now positions organizations to compete in a future where speed and predictive intelligence define winners. With the right approach and an experienced partner like Andolasoft, businesses can confidently turn data into a strategic asset — not an operational burden.

FAQs

1. What is BI and AI in simple terms?

BI and AI combine business intelligence reporting with artificial predictive intelligence to analyze data, predict outcomes, and recommend actions automatically.

2. How is BI and AI different from traditional BI?

Traditional BI focuses on historical data, while BI and AI adds predictive and prescriptive insights using machine learning models.

3. Which industries benefit most from BI and AI?

Healthcare, eCommerce, fintech, logistics, SaaS, manufacturing, and education see significant value from BI and AI adoption.

4. Is BI and AI only for large enterprises?

No. With cloud and modular architectures, BI and AI is now accessible and scalable for startups and mid-sized businesses.

5. How long does it take to implement BI and AI?

Initial use cases can go live in weeks, while full-scale implementations typically take a few months depending on complexity.

6. What data is required for BI and AI?

Structured and semi-structured data from CRMs, ERPs, applications, and operational systems form the foundation for BI and AI.

7. Why choose Andolasoft for BI and AI projects?

Andolasoft combines deep technical expertise, real-world delivery experience, and business-first thinking to deliver measurable BI and AI outcomes.

Top 10 BI Implementation Mistakes and How to Get It Right?

Business Intelligence initiatives promise data-driven decision-making, operational clarity, and competitive advantage — yet, industry studies consistently show that a significant percentage of BI projects fail to deliver expected ROI. The reason is rarely the technology itself. More often, it is BI implementation mistakes made early in planning, execution, and adoption.

In today’s data-saturated landscape, organizations generate massive volumes of structured and unstructured data across applications, platforms, and devices. However, without a well-defined BI strategy, this data becomes fragmented, unreliable, and underutilized. As a result, leaders make decisions based on incomplete insights, outdated reports, or manual spreadsheets.

This blog breaks down the top 10 BI implementation mistakes organizations make — and more importantly, how to avoid them. You will learn best practices, frameworks, and actionable strategies to build BI systems that scale, perform, and drive measurable outcomes.

Drawing from real-world delivery experience, Andolasoft helps businesses design, build, and modernize BI platforms that convert raw data into actionable intelligence — securely and sustainably.

Top BI Implementation Mistakes

Business Need & Importance of Avoiding BI Implementation Mistakes

Modern businesses operate in environments where speed, accuracy, and insight define success. From healthcare providers optimizing patient outcomes to eCommerce brands improving conversions, BI has become a strategic necessity rather than a reporting add-on.

However, many organizations still struggle because of BI implementation mistakes, such as disconnected data sources, poorly defined metrics, and lack of stakeholder alignment. These issues lead to dashboards that look impressive but fail to answer real business questions.

Why BI matters today:

  • Healthcare: Enables predictive analytics, operational efficiency, and compliance reporting — without compromising data security.
  • eCommerce & SaaS: Drives personalization, churn reduction, and revenue forecasting through real-time insights.
  • Logistics & Manufacturing: Improves demand forecasting, inventory optimization, and cost control.
  • Fintech & Education: Ensures transparency, risk management, and performance tracking across complex systems.

Risks of poor BI implementation:

  • Inefficient decision-making due to inconsistent or inaccurate data
  • Security vulnerabilities caused by unmanaged data access
  • Low user adoption when BI tools are complex or irrelevant
  • Revenue loss from delayed insights and reactive strategies

Therefore, companies must move beyond patchwork tools and legacy reporting. They need modern, scalable BI solutions designed with clear business alignment — something Andolasoft specializes in through its BI, data analytics, and digital transformation services.

Top 10 BI Implementation Mistakes

1. Lack of Clear Business Objectives

Many BI projects start with tools instead of outcomes. Without defined goals, dashboards become cluttered and unused.

Best practice: Align BI initiatives with KPIs such as revenue growth, operational efficiency, or customer retention.

2. Poor Data Quality and Governance

Inconsistent, duplicate, or outdated data undermines trust in BI systems.

Best practice: Implement strong data governance, validation rules, and ownership models early.

3. Ignoring End-User Needs

BI built only for leadership often fails adoption at operational levels.

Best practice: Design role-based dashboards tailored for executives, managers, and frontline teams.

4. Overcomplicated Architecture

Excessive tools, pipelines, and integrations increase maintenance costs.

Best practice: Use modular, cloud-ready architectures with scalable data pipelines.

5. Underestimating Change Management

Users resist BI if it disrupts workflows without training.

Best practice: Invest in onboarding, documentation, and continuous enablement.

6. Choosing the Wrong Tech Stack

Not all BI tools fit all use cases.

Best practice: Select tools based on data volume, latency, security, and integration needs.

7. No Real-Time or Near-Real-Time Capabilities

Static reports limit agility.

Best practice: Enable real-time dashboards for critical business functions.

8. Weak Security & Compliance Planning

BI systems often expose sensitive data.

Best practice: Apply role-based access control, encryption, and compliance frameworks.

9. Failing to Plan for Scale

What works for 10 users fails at 1,000.

Best practice: Architect BI for future growth in users, data sources, and analytics complexity.

10. Treating BI as a One-Time Project

BI requires continuous evolution.

Best practice: Adopt an iterative improvement model with regular feedback loops.

Customer Success

For example, a mid-sized eCommerce SaaS company partnered with Andolasoft to overcome recurring BI implementation mistakes that limited visibility into customer behavior and revenue trends.

The company struggled with siloed data across CRM, marketing automation, and finance tools. Reports were manually generated, often inconsistent, and delayed by weeks.

Andolasoft designed a unified BI architecture that integrated all data sources into a centralized analytics platform. Role-based dashboards were created for leadership, marketing, and operations teams. Automated pipelines ensured real-time data availability with built-in governance and security controls.

Results within 4 months:

  • 35% faster decision-making cycles
  • 28% improvement in campaign ROI
  • 50% reduction in manual reporting effort
  • Single source of truth across departments

The transformation allowed leadership to shift from reactive decisions to proactive, insight-led strategies — demonstrating the value of avoiding common BI implementation mistakes with the right technology partner.

Key Takeaways & Closing

Successful BI initiatives are not about dashboards — they are about decisions, outcomes, and impact. Most failures stem from avoidable BI implementation mistakes, including unclear goals, poor data quality, and lack of user adoption.

The most important takeaways:

  • Start with business objectives, not tools
  • Invest in data governance and security
  • Design BI for users, scale, and continuous improvement
  • Choose experienced partners who understand both technology and business

As data complexity grows, organizations that modernize BI thoughtfully will gain a decisive advantage. With deep expertise in BI, AI, data analytics, SaaS engineering, and digital transformation, Andolasoft helps businesses build future-ready BI platforms that deliver lasting value.

Avoid the pitfalls. Build BI the right way — starting now.

FAQs

1. What are the most common BI implementation mistakes?

The most common BI implementation mistakes include unclear objectives, poor data quality, low user adoption, and lack of scalability planning.

2. Why do BI projects fail despite good tools?

BI fails due to strategy, governance, and adoption issues — not because of tools. Avoiding BI implementation mistakes requires business alignment.

3. How long does a successful BI implementation take?

A well-planned BI implementation typically takes 3–6 months, depending on data complexity and integration scope.

4. How can companies improve BI adoption?

User-centric design, role-based dashboards, and training significantly improve BI adoption.

5. Is cloud BI better for modern businesses?

Yes. Cloud BI offers scalability, cost efficiency, and faster deployment when implemented correctly.

6. How does Andolasoft support BI initiatives?

Andolasoft provides end-to-end BI services, including strategy, architecture, development, analytics, and ongoing optimization.

7. Can BI be integrated with AI and machine learning?

Absolutely. Modern BI platforms integrate AI and ML for predictive insights, anomaly detection, and automation.