Power BI Migration Services: Amazing Steps to Boost Your ROI

Imagine running your business on outdated dashboards that take hours to refresh, missing the real-time insights your competitors are already acting on. Power BI migration services are transforming how enterprises and SMEs access data intelligence — and the ROI impact is undeniable.

A 2024 Forrester Total Economic Impact study found that organizations migrating to Microsoft Power BI realized an average 354% ROI over three years, with payback in under six months. However, many businesses stall at the starting line because migration feels complex, risky, and resource-intensive.

Therefore, this guide walks you through every critical step of Power BI migration services — from audit to go-live — so your team can move faster, smarter, and with measurable returns from day one.

What Are Power BI Migration Services?

Power BI migration services encompass the full lifecycle of moving your legacy BI environment — whether that’s Tableau, Crystal Reports, SSRS, Cognos, QlikView, or on-premise data warehouses — to Microsoft Power BI’s modern cloud analytics platform.

Specifically, these services include assessment, data modeling, report migration, governance setup, performance optimization, training, and ongoing support. Furthermore, when done right, migration eliminates technical debt, reduces licensing costs, and gives every stakeholder — from the C-suite to field sales — access to accurate, real-time data.

At Andolasoft, we have helped SMEs, SaaS companies, and enterprise teams across BFSI, NBFC, and retail sectors execute seamless Power BI migrations that deliver measurable ROI within the first quarter.

Why Businesses Are Migrating to Power BI in 2026

The push toward Power BI is not just a trend — it is a strategic business imperative. Moreover, here is what is driving the shift:

  • Cost efficiency: Power BI Pro costs significantly less than legacy platforms like Tableau Server or Cognos Analytics.
  • Microsoft ecosystem integration: Native connectors to Azure, Teams, SharePoint, Dynamics 365, and Excel eliminate data silos instantly.
  • Real-time intelligence: DirectQuery and streaming datasets give decision-makers live access to KPIs without waiting for batch refreshes.
  • Scalability: Power BI Premium Gen2 scales elastically, removing the infrastructure burden from your IT team.
  • AI-augmented analytics: Built-in AutoML, Key Influencers, Q&A, and Copilot capabilities reduce the time from data to decision.

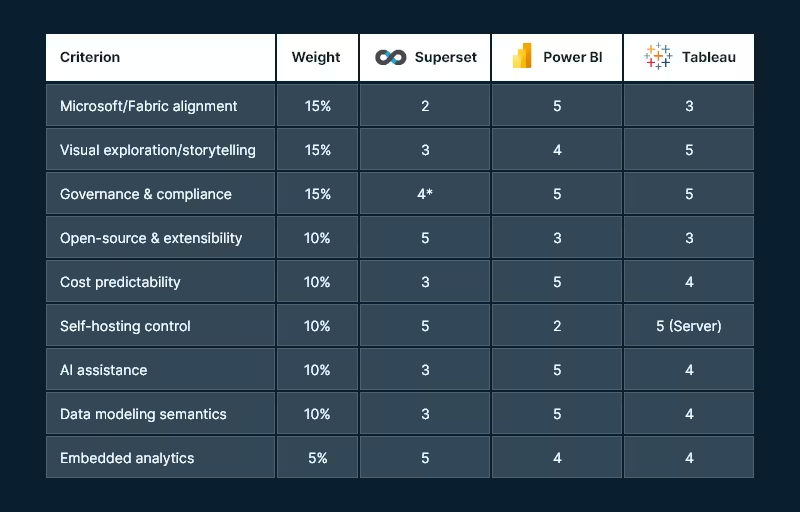
In addition, for organizations already using Superset BI or similar open-source tools, Power BI adds enterprise governance, role-level security, and Microsoft-backed SLAs that open-source tools simply cannot match at scale.

Step 1: Conduct a Comprehensive BI Environment Audit

Before migrating a single report, you need a crystal-clear picture of what you have. Indeed, a thorough audit prevents surprise failures during cutover and ensures nothing critical gets left behind.

Key audit activities include:

  • Inventory all existing reports, dashboards, and data sources
  • Identify report owners, usage frequency, and business criticality
  • Document data flows, ETL pipelines, and refresh schedules
  • Assess data quality and identify cleansing requirements
  • Map current licensing costs vs. projected Power BI licensing spend

At this stage, our data analytics team typically discovers that 30–40% of legacy reports are either duplicated or unused. Consequently, eliminating them immediately reduces migration scope and cost.

ROI Impact: Clients who complete a formal audit reduce migration timelines by an average of 35% compared to those who skip this step. Therefore, the audit phase is never optional.

Step 2: Define a Migration Strategy and Roadmap

Not all reports should migrate at once. Instead, a phased, risk-tiered approach protects business continuity while delivering early wins that build internal confidence.

Prioritization framework:

  • Phase 1 — Quick wins: High-usage, low-complexity reports that showcase Power BI’s value immediately
  • Phase 2 — Core operational reports: Mission-critical dashboards with complex data models
  • Phase 3 — Advanced analytics: Predictive models, AI visuals, and embedded analytics

Furthermore, this roadmap directly supports your digital transformation strategy — ensuring BI migration aligns with broader modernization goals, not just IT timelines.

Step 3: Modernize Your Data Architecture

Power BI is only as powerful as the data behind it. Moreover, migration is the ideal moment to modernize your data architecture for performance, reliability, and governance.

Architecture modernization checklist:

  • Move from on-premise SQL to Azure SQL, Azure Synapse, or Fabric
  • Implement a medallion architecture (Bronze → Silver → Gold layers) for clean, structured data
  • Replace legacy ETL with Azure Data Factory or Dataflow Gen2 pipelines
  • Standardize semantic models to avoid redundant datasets across teams
  • Enable row-level security (RLS) to protect sensitive business data

As a result, our cloud infrastructure experts architect data environments that make Power BI reports refresh 5–10x faster than legacy on-premise solutions. Specifically, this is a measurable performance gain that users notice immediately.

Step 4: Migrate and Rebuild Reports in Power BI

This is where the actual migration happens. Additionally, depending on your source platform, approaches vary significantly.

From Tableau: Use the Migration Wizard or third-party tools, then manually refine visuals and DAX calculations to match Power BI’s rendering engine.

From SSRS / Crystal Reports: Leverage the RDL migration tool for basic reports. Subsequently, rebuild complex paginated reports using Power BI Report Builder for pixel-perfect output.

From Cognos / Qlik: A full rebuild is typically required. However, data models can often be repurposed with adjustments for DAX vs. SQL.

Best practices during migration:

  • Build a report validation checklist to compare output between legacy and new reports
  • Use calculation groups and field parameters to simplify complex DAX
  • Standardize color palettes, fonts, and layout grids across all reports for brand consistency
  • Implement incremental refresh on large fact tables to minimize refresh windows

In particular, our application modernization team runs parallel validation sprints — ensuring migrated reports match legacy outputs to 100% accuracy before any cutover decision is made.

Step 5: Implement Governance and Security

One of the most overlooked steps in Power BI migration is establishing a robust governance framework. Without it, you end up with sprawling workspaces, inconsistent metrics, and security vulnerabilities. Therefore, governance must be planned from day one.

Governance essentials:

  • Workspace strategy: Define Dev / Test / Production workspace hierarchy
  • Deployment pipelines: Automate promotion of content across environments
  • Certified datasets: Mark authoritative data sources to prevent shadow BI
  • Usage metrics: Monitor report consumption to retire unused content proactively
  • Data lineage: Track how data flows from source to report for audit compliance

For BFSI and NBFC clients, our data analytics for BFSI and NBFC teams layer additional compliance controls. As a result, these controls include audit logging, sensitivity labels, and Microsoft Purview integration.

In addition, strong governance connects directly to your digital governance strategy, ensuring BI assets are discoverable, trusted, and compliant across the organization.

Step 6: Enable Intelligent Automation and AI Features

Power BI’s competitive edge lies in its embedded AI capabilities. Moreover, migration is the right moment to activate these features and drive ROI beyond traditional reporting.

AI features to activate post-migration:

  • Copilot in Power BI: Let business users generate reports through natural language prompts
  • Key Influencers visual: Automatically identifies what drives KPI fluctuations
  • Anomaly Detection: Surfaces unexpected data spikes or drops in real time
  • Smart Narratives: Auto-generates plain-language summaries of dashboard insights
  • AutoML integration: Train predictive models directly within Power BI using Azure ML

Furthermore, these capabilities align with our intelligent automation services and autonomous AI assistant solutions. Ultimately, this gives your team an analytics environment that gets smarter over time, not just static dashboards.

Step 7: Train Teams and Drive User Adoption

Even the most technically perfect migration fails if users do not adopt the new platform. Therefore, change management and training are mission-critical for ROI realization.

Effective adoption strategies:

  • Run role-based training sessions (executives, analysts, operational users)
  • Create an internal Power BI Champions program to drive peer learning
  • Build a self-service report catalog so users can discover insights without IT dependency
  • Establish a Power BI Center of Excellence (CoE) to govern growth and best practices
  • Use enterprise project management frameworks to track adoption milestones against business goals

In fact, organizations that invest in structured adoption programs see 2x faster time-to-insight. Additionally, they achieve significantly higher report usage rates compared to those that skip formal training.

Step 8: Measure, Optimize, and Iterate

Migration is not a one-time event — it is the beginning of a continuous improvement cycle. Consequently, post-migration optimization directly impacts your long-term ROI.

Post-migration optimization priorities:

  • Use Power BI Premium Metrics app to monitor dataset performance and query times
  • Optimize slow DAX measures using DAX Studio and Tabular Editor
  • Review and consolidate overlapping datasets across workspaces
  • Expand embedded analytics into customer-facing portals or eCommerce platforms
  • Schedule quarterly BI reviews to align report roadmap with evolving business priorities

Meanwhile, our quality assurance team conducts periodic performance audits to ensure your Power BI environment continues to scale efficiently as data volumes grow.

Real-World ROI: Power BI Migration in Action

Here is what measurable success looks like across industries we have served:

Financial Services (BFSI): A leading NBFC migrated 120 Crystal Reports dashboards to Power BI in 12 weeks. As a result, the client achieved a 68% reduction in report generation time, 40% lower BI licensing cost, and real-time loan monitoring. For more details, see our loan monitoring system and loan analytics capabilities.

SaaS Company: The company migrated from Tableau Online to Power BI Premium. Consequently, they achieved $180K in annual licensing savings, a 3x increase in self-service report creation, and full integration with Microsoft Teams for in-context analytics.

Retail Enterprise: The retailer consolidated 14 disconnected reporting tools into a unified Power BI environment. Therefore, they gained a single version of truth across 8 regional offices, a 90% reduction in data reconciliation effort, and real-time inventory visibility driving $2.3M in working capital optimization.

Common Power BI Migration Challenges — and How We Solve Them

Understanding the pitfalls helps you avoid them. In particular, here are the most common challenges and proven solutions:

1. Complex DAX vs. Legacy Calculated Fields: Legacy platforms use proprietary calculation languages. However, our data engineers rebuild calculations in optimized DAX, often improving query performance by 50–80% in the process.

2. Data Quality Issues Surfaced During Migration: Migration exposes hidden data quality problems. Fortunately, we implement data cleansing pipelines as part of the migration — turning a challenge into a long-term data quality improvement.

3. User Resistance to Change: We address this through our structured change management program. Specifically, we identify internal champions early and build momentum before the formal go-live date.

4. Performance Bottlenecks with Large Datasets: We apply aggregation tables, composite models, and incremental refresh strategies. As a result, we ensure sub-second query performance even on billion-row datasets.

Overall, our AI framework services and enterprise integration capabilities ensure that even the most complex BI ecosystems migrate cleanly and perform reliably.

Why Choose Andolasoft for Power BI Migration Services?

With over 15 years of experience in enterprise data and analytics, Andolasoft brings a proven methodology, certified Microsoft Power BI engineers, and deep industry expertise. In addition, we serve clients across BFSI, healthcare, retail, and SaaS sectors.

What sets us apart:

  • End-to-end migration ownership — from audit through post-go-live optimization
  • Fixed-price migration packages for predictable ROI planning
  • Certified Power BI specialists with hands-on Azure and Fabric experience
  • Industry-specific compliance knowledge for regulated industries
  • Geo-spatial BI capabilities for location-driven analytics via geo-spatial engineering services
  • Continuous innovation through our Innovation & Product R&D practice

Ultimately, you can explore our full capabilities at the Andolasoft Blog and discover how we help organizations unlock the full value of their data investments.

Conclusion: Your ROI Journey Starts With the First Step

Power BI migration is not just a technology upgrade — it is a strategic investment in your organization’s ability to compete on data. Moreover, every week you delay is a week your competitors gain ground with faster insights, lower costs, and smarter decisions.

The steps outlined in this guide give you a proven roadmap: audit, strategize, modernize, migrate, govern, automate, train, and optimize. Furthermore, each phase builds on the last, compounding ROI with every milestone.

Therefore, ready to start? Book a free Power BI migration assessment with Andolasoft today — and let us build a faster, smarter analytics foundation for your business.

Frequently Asked Questions

1. What is included in Power BI migration services?

Power BI migration services include BI environment auditing, data architecture modernization, report rebuilding, governance setup, performance optimization, user training, and post-migration support. In summary, they cover the complete journey from legacy platform to Microsoft Power BI.

2. How long does a Power BI migration take?

Migration timelines depend on the volume and complexity of existing reports. For instance, small environments (under 50 reports) typically migrate in 4–8 weeks. However, enterprise migrations with 200+ reports and complex data models may take 3–6 months with a phased approach.

3. Which legacy BI tools can be migrated to Power BI?

Power BI migration services support migrations from Tableau, SSRS, Crystal Reports, Cognos, QlikView, Qlik Sense, MicroStrategy, Looker, and custom-built SQL Server reporting solutions. Furthermore, most data models can be repurposed during migration.

4. What is the ROI of migrating to Power BI?

Forrester research shows organizations achieve an average 354% ROI over three years from Power BI adoption. Specifically, key value drivers include reduced licensing costs, faster decision-making, IT efficiency gains, and improved data accuracy.

5. Is Power BI migration disruptive to daily business operations?

A well-planned phased migration minimizes disruption. Therefore, legacy systems run in parallel with Power BI during the transition period, ensuring business continuity until the new environment is fully validated.

6. What data sources does Power BI connect to?

Power BI connects to 200+ data sources natively, including Azure SQL, Snowflake, Google BigQuery, Salesforce, Dynamics 365, SharePoint, Excel, SAP, and virtually any database via ODBC or REST API connectors. Moreover, new connectors are added regularly through Microsoft updates.

7. Do we need to replace our existing data warehouse during migration?

Not necessarily. Power BI can connect to your existing data warehouse. However, migration is an ideal opportunity to evaluate modernization to Azure Synapse or Microsoft Fabric for enhanced performance and AI capabilities.

8. How does Power BI handle data security after migration?

Power BI supports row-level security (RLS), object-level security (OLS), Microsoft Purview sensitivity labels, and Azure Active Directory integration. As a result, all user roles receive enterprise-grade data protection.

9. Can Power BI embed analytics into our existing applications?

Yes. Power BI Embedded allows you to integrate interactive dashboards into web apps, portals, and SaaS products using REST APIs and JavaScript SDKs. Consequently, you can extend analytics to customers and partners without requiring Power BI licenses.

10. How do I get started with Power BI migration services from Andolasoft?

Contact the Andolasoft data analytics team to schedule a free migration assessment. We will audit your current environment, define a migration roadmap, and provide a fixed-price proposal within 5 business days. Therefore, there is no reason to delay your migration journey any further.

Apache Superset vs Power BI: Which Wins in 2026?

Introduction

The Apache Superset vs Power BI debate has become one of the most consequential decisions in the business intelligence landscape in 2026. Data teams are under pressure to deliver faster insights, cut tool costs, and integrate AI-driven analytics into their workflows. At the center of that debate, two platforms consistently dominate the conversation: Apache Superset and Microsoft Power BI.

Both tools can visualize data beautifully. Both serve large enterprises. But they are built on fundamentally different philosophies, and choosing the wrong one for your organization can cost you months of migration pain and hundreds of thousands of dollars in licensing.

At Andolasoft, our engineering teams have deployed and managed both platforms across industries — from fintech and pharma to construction and retail. We’ve helped clients like Arvest Bank, Aurobindo Pharma, and Bosch make this exact decision. This comparison is not theoretical. It’s drawn from real implementations, real migrations, and real performance benchmarks across production environments.

Whether you’re evaluating your first BI platform or reconsidering an existing investment, this guide gives you the definitive Apache Superset vs Power BI answer for 2026.

What Is Apache Superset?

Apache Superset is a modern, open-source data analytics and business intelligence platform developed at Airbnb and now maintained under the Apache Software Foundation. It is written in Python with a React-based frontend, and is designed to connect directly to your existing SQL databases and data warehouses — no proprietary data layer required.

Superset supports a wide range of chart types, including bar charts, line charts, heatmaps, geospatial maps, and time-series visualizations. It features SQL Lab, a powerful in-browser SQL IDE, and a no-code chart builder for analysts who prefer a visual interface. It is cloud-native and designed to run on Kubernetes or Docker in environments you fully control.

What Is Microsoft Power BI?

Microsoft Power BI is a cloud-hosted, SaaS-based BI and reporting platform that is deeply integrated with the Microsoft 365 ecosystem — Azure, Excel, Teams, SharePoint, and the broader Power Platform. It offers a rich desktop authoring experience (Power BI Desktop), a cloud-hosted service (Power BI Service), and an embedded analytics SDK for developers.

Power BI’s low barrier to entry, intuitive drag-and-drop interface, and deep Microsoft ecosystem integration have made it one of the most widely adopted BI tools globally, especially in enterprises already running on Azure and Office 365.

Apache Superset vs Power BI: Head-to-Head Comparison

1. Cost and Licensing

This is often the deciding factor for growing organizations comparing Apache Superset vs Power BI.

Power BI uses a per-user SaaS pricing model. Power BI Pro costs approximately $10 per user per month, while Power BI Premium Per User (PPU) runs around $20 per user per month. For larger deployments needing Premium capacity, costs scale sharply — Premium capacity nodes start at several thousand dollars per month.

Apache Superset is free and open source under the Apache 2.0 license. Your only costs are the cloud infrastructure you choose to run it on — typically an AWS EC2 instance, a managed PostgreSQL database (Amazon RDS), and Redis for caching. For most mid-sized teams, this translates to $50–$300/month in infrastructure costs, regardless of how many users access the platform.

See how one of our clients cut their BI bill by 83% using Apache Superset — a real-world case study that shows the cost advantage in action.

Winner: Apache Superset — for cost-conscious organizations and teams scaling beyond 50+ users, the savings are substantial and compounding.

2. Ease of Use and Learning Curve

Power BI wins here for non-technical users. Its drag-and-drop report builder, Excel-like DAX formula language, and extensive Microsoft documentation make it accessible to business analysts with minimal technical training. The Power BI Desktop application is polished and intuitive.

Apache Superset has a steeper initial learning curve, particularly for organizations without internal DevOps capability. Setting up a Superset deployment requires Linux, Docker, Python, and SQL familiarity. However, once deployed, its SQL Lab, no-code chart builder, and dashboard interface are straightforward for analysts to use day-to-day.

Winner: Power BI — for business-led, low-code teams. Superset for technically mature data organizations.

3. Data Source Connectivity

Apache Superset supports over 40 database connections via SQLAlchemy and Apache Arrow Flight SQL, including every major cloud data warehouse and OLAP engine. It is database-agnostic by design. You can query Amazon Redshift, Snowflake, Databricks, Apache Druid, and Trino from the same interface without any data movement.

Power BI offers hundreds of built-in connectors through its proprietary Power Query engine. However, many connectors require Premium licensing to use in production at scale, and connecting to non-Microsoft data sources often requires additional configuration or gateways.

Learn more about must-have enterprise BI features that modern applications require for seamless data source connectivity.

Winner: Apache Superset — for multi-cloud, polyglot data environments. Power BI for Microsoft-first ecosystems.

4. Performance and Scalability

Apache Superset is a query engine-agnostic visualization layer. It pushes computation directly to your underlying data warehouse — Druid, ClickHouse, BigQuery, Redshift — and leverages those engines’ native optimization capabilities. It can scale horizontally on Kubernetes or vertically on larger EC2 instances based on demand. Andolasoft has deployed Superset environments serving hundreds of concurrent users across financial dashboards with no degradation.

Power BI scales well within the Microsoft ecosystem, but Premium capacity constraints can create bottlenecks during high-concurrency usage peaks. Organizations using Power BI’s shared capacity tiers often encounter report refresh rate limits and query throttling at scale.

If you’re evaluating why companies are migrating to cloud-based BI in 2026, scalability is consistently one of the top drivers.

Winner: Apache Superset — for high-concurrency, large-scale analytical workloads.

5. Customization and Extensibility

Apache Superset is fully open source and built on standard web technologies. Your team can contribute custom visualization plugins written in React, build custom authentication backends (LDAP, SAML, OAuth2), extend the API, and white-label the entire interface. Everything is customizable because everything is yours.

Power BI offers some customization via custom visuals (built with the Power BI Visuals SDK) and embedded analytics. However, you are always operating within boundaries set by Microsoft. You cannot customize the core application, alter the branding beyond limited options, or self-host the full Power BI service.

Explore how organizations are leveraging Superset for scalable and customizable data analytics across different industry verticals.

Winner: Apache Superset — for teams that need bespoke visualizations, white-labeling, or deep platform integration.

6. AI and Machine Learning Integration

Power BI has accelerated its AI roadmap through Microsoft Copilot integration, allowing users to generate reports, write DAX measures, and summarize dashboards using natural language prompts directly inside the Power BI interface. For organizations already in the Microsoft 365 ecosystem, this is a genuine productivity accelerator.

Apache Superset does not ship with built-in LLM features out of the box, but its open API architecture means your engineering team can integrate any AI layer — OpenAI, Anthropic, or a self-hosted LLM — directly into the platform. At Andolasoft, we have built custom NL-to-SQL query assistants on top of Superset deployments, allowing analysts to query dashboards in plain English with responses grounded in live warehouse data.

Predictive BI capabilities are increasingly important in 2026 — discover how modern platforms transform raw data into forward-looking insights.

Winner: Power BI out of the box for non-technical Copilot users. Apache Superset for organizations that want full control over their AI integration stack.

7. Security, Governance, and Data Residency

Apache Superset runs entirely within your own infrastructure — your VPC, your network, your encryption keys. Data never leaves your environment. For regulated industries (healthcare, banking, defense), this is not just a preference — it is a compliance requirement. Superset supports Row-Level Security (RLS), OAuth2, SAML, LDAP, and full audit logging.

Power BI is a SaaS product hosted on Microsoft’s Azure infrastructure. While Microsoft holds robust certifications (ISO 27001, SOC 2, HIPAA BAA), enterprise data still flows through and is processed on Microsoft servers. Organizations with strict data residency laws or air-gapped environments face real challenges with this model.

Review our guide on data governance and security best practices for Superset deployments to understand how to implement enterprise-grade controls.

For a broader overview of data governance practices for reliable BI insights, explore how leading organizations structure their governance frameworks.

Winner: Apache Superset — for data privacy, residency compliance, and regulated industries.

Apache Superset vs Power BI: Summary Comparison Table

Criteria Apache Superset Power BI
Cost Free (open source) $10–$20+/user/month
Ease of Use Technical teams Business users
Data Sources 40+ via SQLAlchemy Hundreds (some Premium)
Scalability Horizontal, Kubernetes-native Premium capacity limits
Customization Fully open, white-label Limited, Microsoft-controlled
AI Integration Custom LLM via open API Copilot (Microsoft 365)
Security Self-hosted, full control Azure-hosted SaaS

Who Should Choose Apache Superset?

Choose Superset if you have an engineering team comfortable with Python/Docker, need to control infrastructure and data residency, want to avoid per-user licensing at scale, need to embed analytics directly into a SaaS product, or are building on a multi-cloud or hybrid data stack.

Companies evaluating top embedded BI platforms for SaaS companies consistently find that Superset’s open architecture and white-labeling capabilities make it the preferred choice.

The role of embedded BI in enhancing SaaS products has grown significantly — Superset’s open-source model gives SaaS builders complete control over their analytics experience.

Who Should Choose Power BI?

Choose Power BI if your organization is already deeply invested in Microsoft 365 and Azure, your analysts are non-technical business users, you need rapid time-to-insight without infrastructure management, or you want Copilot-assisted reporting out of the box.

Understanding the top BI implementation mistakes before you commit to either platform can save your team significant time and resources during rollout.

For an unbiased industry perspective, the Gartner Magic Quadrant for Analytics and BI Platforms provides a useful benchmarking framework when evaluating both tools.

How Does Andolasoft Help with Apache Superset vs Power BI?

At Andolasoft, our Apache Superset BI Services help organizations evaluate, deploy, and scale both platforms based on their unique technical requirements, compliance needs, and team capabilities.

We’ve seen firsthand how Apache Superset, when deployed and configured correctly, outperforms Power BI on cost, scalability, data privacy, and long-term flexibility for almost every technically capable team. The perceived complexity of Superset is a deployment and operations problem — one that a specialized partner can solve in days, not months.

That is exactly what Andolasoft’s Apache Superset BI practice does. From initial architecture to production deployment, custom visualization plugins to enterprise RBAC configuration, we handle the complexity so your analysts can focus on insights.

If you’re still comparing options, our in-depth guide on Apache Superset vs Power BI vs Tableau provides a three-way enterprise comparison to help you finalize your decision.

You can also explore Apache Superset vs Tableau: 2026 Full Comparison and learn what makes Superset stand out from other BI tools on the market today.

Ready to evaluate Apache Superset for your organization? Talk to our data engineering team for a free architecture consultation.

Must-Have Enterprise BI Features for Modern Applications

Enterprise software no longer competes on features alone. It competes on how fast decisions are made, how accurately performance is measured, and how quickly leaders can respond to change. That is exactly why enterprise BI has moved from a “nice-to-have” analytics layer to a core operating system for decision-making.

Today, every serious enterprise application — whether it is ERP, CRM, HRMS, FSM, construction management, or financial systems — must embed or integrate BI at its core.

However, not all analytics are created equal.

True enterprise BI is not about pretty dashboards. Instead, it is about governance, scale, trust, performance, security, and decision velocity. Therefore, choosing the right BI features is a strategic architecture decision, not a UI decision.

In this definitive guide, you will learn:

  • What enterprise BI really means in modern enterprises
  • Why basic reporting tools fail at scale
  • The must-have BI features for any serious enterprise application
  • How BI drives adoption, ROI, and competitive advantage
  • How to evaluate an BI platform properly

Let us begin with the fundamentals.

Must-Have-Enterprise-BI-Features-at-a-Glance

What Is Enterprise BI?

It (Enterprise Business Intelligence) is a scalable, governed, secure, and performance-driven analytics layer that supports decision-making across the entire organization—from frontline teams to executive leadership.

Unlike basic BI tools, enterprise BI:

  • Serves hundreds or thousands of users
  • Handles millions or billions of rows of data
  • Enforces data governance and security
  • Supports mission-critical business workflows
  • Integrates deeply into core enterprise applications

In other words, BI is not a reporting tool. It is a decision infrastructure.

Why Basic BI Fails in Enterprise Environments

Many organizations start with simple dashboards. However, they quickly hit limitations.

Basic BI fails because:

  • It cannot scale to large data volumes
  • It breaks under concurrent user load
  • It lacks role-based security and governance
  • It creates multiple versions of truth
  • It depends heavily on analysts instead of business users
  • It does not integrate deeply into enterprise workflows

As a result, enterprises either:

  • Lose trust in data
  • Slow down decision-making
  • Or build expensive, fragmented analytics stacks

This is exactly why enterprise BI exists.

The Strategic Role of Enterprise BI in Enterprise Applications

Modern enterprise applications are no longer transactional systems only. They are decision platforms.

Therefore, BI must:

  • Power daily operational decisions
  • Support strategic leadership decisions
  • Enable cross-department visibility
  • Drive process optimization
  • Enforce data accountability
  • Accelerate business execution

Consequently, BI becomes a core competitive advantage.

Must-Have Enterprise BI Features (Complete Enterprise Checklist)

Below is the definitive feature framework for evaluating or building a true BI system.

1. Enterprise-Grade Data Architecture

BI must handle complexity at scale.

It must support:

  • Multiple data sources (ERP, CRM, HRMS, IoT, Finance, Ops, external data)
  • Structured and semi-structured data
  • Large volumes and high refresh rates
  • Historical and real-time data together

Core capabilities include:

  • Data connectors and ingestion pipelines
  • Data modeling and semantic layers
  • Incremental refresh and caching
  • Support for cloud, on-prem, and hybrid data

Without this foundation, enterprise BI collapses under growth.

2. Single Source of Truth (Semantic Layer)

One of the biggest reasons BI fails is metric chaos.

Therefore, enterprise BI must provide:

  • Centralized metric definitions
  • Business-friendly semantic models
  • Reusable KPIs across dashboards and apps
  • Governance over calculations and logic

Benefits:

  • No conflicting numbers
  • No department-level data politics
  • No spreadsheet shadow systems
  • High trust in executive reporting

In short, BI must enforce truth at scale.

3. Enterprise Security and Access Control

Enterprise BI is useless if it is not secure.

It must support:

  • Role-based access control (RBAC)
  • Row-level and column-level security
  • SSO and enterprise authentication (SAML, OAuth, LDAP, etc.)
  • Audit logs and access tracking
  • Data masking for sensitive fields

Why this matters:

  • Finance, HR, and leadership data must not leak
  • Compliance requirements demand strict controls
  • Large organizations cannot rely on manual permissions

Therefore, security is not optional in BI. It is foundational.

4. Performance at Scale

Enterprise BI must stay fast even when:

  • Data grows 10x
  • Users grow 50x
  • Queries become complex
  • Dashboards become heavier

Critical performance features include:

  • Intelligent caching
  • Query optimization
  • In-memory acceleration
  • Pre-aggregations
  • Load balancing
  • Asynchronous query execution

Because in enterprises:

If dashboards are slow, decisions are slow. And slow decisions cost money.

5. Embedded Analytics for Enterprise Applications

Modern enterprise BI must not live in a separate portal.

Instead, it must:

  • Embed inside ERP, CRM, HRMS, FSM, or industry apps
  • Respect application user permissions
  • Adapt to application workflows
  • Feel like a native feature

Embedded BI enables:

  • Contextual decision-making
  • Higher adoption
  • Better user experience
  • Stronger product differentiation

Today, enterprise BI is a product feature, not a separate product.

6. Self-Service Analytics for Business Users

BI cannot depend entirely on analysts.

It must empower:

  • Managers
  • Operations leaders
  • Finance teams
  • Sales leaders
  • Department heads

Self-service features include:

  • Drag-and-drop reports
  • Filter and slice-and-dice
  • Drill-down and drill-through
  • Custom views and saved dashboards
  • Ad-hoc exploration without SQL

This ensures:

  • Faster answers
  • Less dependency on data teams
  • Higher data culture maturity

7. Advanced Dashboarding and Visualization

Enterprise BI dashboards must support:

  • Executive-level KPI views
  • Operational performance views
  • Departmental scorecards
  • Process monitoring screens

Core visualization capabilities:

  • Interactive charts and tables
  • Cross-filtering
  • Drill-down hierarchies
  • Conditional formatting
  • Alerts and thresholds
  • Storytelling views

However, remember:

Enterprise BI is not about visuals. It is about decisions enabled by visuals.

8. Real-Time and Near Real-Time Analytics

Many enterprise use cases require:

  • Live operations monitoring
  • SLA tracking
  • Incident detection
  • Financial risk control
  • Supply chain visibility

Therefore, BI should support:

  • Streaming or near-real-time data
  • Incremental refresh
  • Low-latency dashboards
  • Operational alerting

This transforms enterprise BI from reporting to control systems.

9. Alerts, Automation, and Decision Triggers

Modern BI must not wait for users to open dashboards.

It must:

  • Push alerts when thresholds are crossed
  • Trigger workflows
  • Send notifications to email, Slack, Teams, etc.
  • Integrate with business processes

Examples:

  • Alert when cash flow drops below limit
  • Alert when project cost overruns
  • Alert when churn risk spikes
  • When compliance metrics fail

This is how enterprise BI becomes proactive instead of reactive.

10. Data Governance and Lineage

At enterprise scale, governance is non-negotiable.

  • BI must provide:
  • Data lineage tracking
  • Impact analysis
  • Change management
  • Certification of datasets
  • Ownership and stewardship models

This ensures:

  • Audit readiness
  • Compliance confidence
  • Trust in enterprise-wide metrics
  • Controlled evolution of analytics

11. Collaboration and Sharing

Enterprise BI is a team sport.

It must support:

  • Shared dashboards
  • Commenting and annotations
  • Versioning
  • Scheduled reports
  • Role-based sharing

This transforms analytics into organizational conversation, not isolated analysis.

12. AI and Advanced Analytics (Optional but Strategic)

Modern enterprise BI increasingly includes:

  • Forecasting
  • Anomaly detection
  • Trend analysis
  • What-if simulations
  • Natural language queries

While not mandatory for every enterprise today, this is rapidly becoming a strategic differentiator.

13. Scalability and Future-Proof Architecture

Enterprise BI must scale across:

  • Users
  • Data volume
  • Use cases
  • Departments
  • Geographies

Therefore, it must support:

  • Modular architecture
  • API-first integration
  • Cloud and hybrid deployment
  • Horizontal scaling
  • Multi-tenant or multi-org setups

How Enterprise BI Drives Real Business Outcomes

When implemented correctly, BI delivers:

  • Faster decision cycles
  • Higher operational efficiency
  • Lower reporting overhead
  • Better leadership visibility
  • Stronger governance
  • Higher ROI from enterprise systems

In short:

BI turns data into organizational leverage.

How to Evaluate an Enterprise BI Platform

Use this checklist:

  • Does it scale to thousands of users?
  • Does it enforce governance and security?
  • Does it embed inside your application?
  • Does it support self-service safely?
  • Does it perform under heavy load?
  • Does it integrate with your data stack?
  • Does it reduce dependency on analysts?

If the answer is “no” to several of these, it is not true BI.

Final Thoughts: Enterprise BI Is Not Optional Anymore

In 2026 and beyond, BI is not an add-on.

It is:

  • A core layer of enterprise architecture
  • A strategic decision platform
  • A competitive advantage
  • A governance system
  • A performance engine

Organizations that treat BI as a strategic system will out-execute, out-learn, and out-scale those that do not.

And that is the real power of BI.

Apache Superset vs Power BI vs Tableau: Which BI Tool Fits Your Enterprise?

Analytics is no longer a single tool decision; it’s a platform choice that shapes your data architecture, governance model, and talent strategy. Cloud data lakes, lakehouses, and streaming sources have expanded, AI is now table stakes, and governance-by-design is the default expectation from CIOs and CISOs. With budgets under pressure, leaders must balance capability, cost, and vendor lock-in. This guide compares Apache Superset, Microsoft Power BI, and Tableau using enterprise-grade criteria so you can select a platform that fits your architecture, scale, and compliance needs—without surprises later.

Snapshot: the three platforms at a glance

Apache_Superset vs. Power BI vs. Tablue

Core evaluation criteria

  1. Data connectivity & modeling
  2. Visualization & self-service
  3. Governance, security & compliance
  4. Pricing & TCO
  5. AI & automation
  6. Deployment, scalability & performance
  7. Ecosystem & extensibility

Data connectivity & modeling

Apache Superset

Superset connects to SQL-speaking databases through Python DB-API drivers and SQLAlchemy dialects — great for lakehouses and modern warehouses. This approach offers broad coverage and makes adding new engines straightforward, provided drivers/dialects exist.

Modeling approach: SQL-first. You’ll define datasets as saved queries or table references. Complex semantic modeling (like ragged hierarchies or row-level calc logic) is possible but typically handled in the data layer (dbt, views, materializations) or via custom code.

Power BI

Power BI provides multiple modes (Import, DirectQuery, Direct Lake with Fabric) and a robust semantic model (tabular) supporting measures, relationships, and calculations via DAX. The product is increasingly intertwined with Microsoft Fabric (Lakehouse, Dataflows Gen2, Pipelines) to unify ingestion, transformation, and modeling.

Tableau

Tableau connects broadly and emphasizes flexible joins/relationships via the Tableau Data Model, plus Tableau Prep for visual data prep. Prep Builder (authoring) and Prep Conductor (orchestration) integrate into a governed pipeline with the Data Management add-on.

Bottom line:

  • Choose Superset if your team is comfortable modeling in SQL/dbt and wants to leverage your warehouse semantics directly.
  • Choose Power BI if you need a governed semantic layer with DAX and tight integration to a Fabric Lakehouse.
  • Choose Tableau if you want visual modeling and prep that business users can learn quickly.

Visualization & self-service analytics

Apache Superset

Superset’s chart gallery covers essentials (time-series, categorical, geospatial, ECharts) and supports custom visualizations. The focus is on efficient exploration and lightweight dashboard authoring. Power users can extend visuals or embed dashboards into internal apps.

Power BI

The Power BI also blends pixel-perfect visuals with enterprise reporting patterns. Shared datasets, Apps, and reusable semantic models support organizational BI at scale. Tight integration with Office 365 and Teams helps business users collaborate around insights.

Tableau

Tableau remains the benchmark for visual exploration and storytelling. Its drag-and-drop paradigm, level-of-detail expressions, and presentation-ready dashboards make it a favorite for analysts and executives. Tableau’s strengths often show in ad-hoc discovery and interactive stories.

Bottom line:

  • Exploration/storytelling first: Tableau.
  • Standardized, governed reporting at scale: Power BI.
  • Customizable OSS exploration & embedded scenarios: Superset.

Governance, security, & compliance

Apache Superset

Authentication and authorization ride on Flask AppBuilder, enabling role-based access control with fine-grained permissions. Superset’s production security guide (v4+) lists best practices for hardening, SSO, and secrets management—important for regulated environments and self-hosting.

Power BI

Power BI’s governance aligns with Microsoft Entra ID (Azure AD), M365 security, and Fabric administration. Licensing tiers add capabilities (e.g., dataset size limits, deployment pipelines, XMLA endpoints). Premium Per User (PPU) delivers most premium features without dedicated capacity—useful for advanced workloads in smaller groups.

Tableau

Tableau offers a mature governance blueprint, with centralized, delegated, and self-governing models to align with your operating model. Its Data Management (Catalog + Prep Conductor) strengthens lineage, trust, and certified data. Deploy to Tableau Cloud (SaaS) or Tableau Server (self-managed) under role-based or core licensing.

Bottom line:

  • Superset gives you complete control — you own the controls and responsibility.
  • Power BI provides enterprise-grade governance out of the box, especially if you’re already standardized on Microsoft identity and security.
  • Tableau provides clear governance models and strong lineage/certification when combined with Data Management.

Pricing & total cost of ownership (TCO)

Apache Superset

License cost is $0 (Apache 2.0), but you’ll incur infrastructure, DevOps, and support costs. The upside: no vendor lock-in and ability to right-size infra and negotiate cloud costs. Feature parity for niche needs might require engineering effort.

Power BI

As of April 1, 2025, Microsoft lists Power BI Pro at USD $14/user/month and PPU at USD $24/user/month, with Premium capacity priced separately. These increases were announced in Nov 2024 and are now in effect.

Tableau

Tableau pricing is role-based. Official materials describe Creator / Explorer / Viewer and deployment options (Cloud/Server). Public sources commonly reference Creator ~ $75/user/month, Explorer ~ $42, Viewer ~ $15 (billed annually); always verify your regional and enterprise terms.

TCO considerations:

  • Superset can have the lowest cash outlay but requires engineering maturity.
  • Power BI offers predictable per-user economics and can reduce integration costs if you already pay for Microsoft 365/Azure.
  • Tableau can be costlier per Creator seat but may shorten time-to-insight thanks to its visual paradigm — valuable for decision velocity.

AI & automation

  • Power BI integrates with Microsoft Fabric and offers Copilot experiences for report creation and narrative insight generation, with governance controls at the tenant level. For orgs pursuing AI-assisted analytics inside a Microsoft stack, this is compelling.
  • Tableau has expanded Data Management and Prep features, with regular new releases that bolster governance and operationalization — complementary to AI-ready data foundations. (Check the current “What’s New” page for recent features relevant to your version.)
  • Superset relies on the OSS ecosystem for AI — e.g., pairing with notebooks, LLM services, or embedding AI APIs. This keeps you flexible but places more responsibility on your platform team.

Deployment, scalability, & performance

Apache Superset

Superset is cloud-native and designed to scale horizontally. You can containerize, run behind a reverse proxy, and integrate with your observability stack. Tuning is in your hands via superset_config.py and infra choices (workers, caches, async queries).

Power BI

SaaS operations are Microsoft-managed. Scaling is typically managed via capacity (Premium) and workspace governance. Fabric unifies ingestion and storage, lowering cross-tool friction and reducing operational complexity.

Tableau

You can choose Tableau Cloud for managed scaling or Tableau Server for on-prem/VMs/K8s. Tableau’s core-based licensing on Server can suit high-concurrency, view-only workloads; role-based licensing helps plan predictable per-user costs.

Ecosystem & extensibility

  • Superset: Python ecosystem, SQLAlchemy, ECharts/Chart plugins, REST API, and embeddable components—ideal for custom apps, internal portals, and bespoke workflows.
  • Power BI: Deep ISV ecosystem, certified visuals, Power Automate flows, and Azure services (Purview, Synapse, Fabric).
  • Tableau: Extensions API, accelerators, Tableau Exchange, and strong community resources for industry-specific dashboards.

Implementation playbooks (by enterprise profile)

Microsoft-centric enterprise (M365, Azure, Fabric)

  • Primary choice: Power BI
  • Why: Single-sign-on via Entra ID, Fabric lakehouse + Direct Lake for scale, governance aligned with your tenant, and Copilot for faster authoring.
  • Risks to manage: Capacity planning and DAX skill development.

Design-led analytics culture (data storytelling, exec consumption)

  • Primary choice: Tableau
  • Why: Visual exploration, LOD expressions, and storytelling make analytics stickier and speed up insight cycles.
  • Risks to manage: Role mix optimization (Creator vs Explorer vs Viewer) and ensuring certified data via Data Management.

Engineering-first platform (data sovereignty, OSS, custom UX)

  • Primary choice: Apache Superset
  • Why: Open-source flexibility, no vendor lock-in, and ability to embed analytics in internal tools.
  • Risks to manage: Operational ownership (security hardening, upgrades, scaling) and the need for internal SLAs.

Highly regulated, on-prem or hybrid

  • Primary choice: Superset or Tableau Server
  • Why: Self-hosting and granular control. Superset demands more DevOps; Tableau Server provides an enterprise-grade commercial option.

Decision worksheet (quick scoring template)

Use a 1–5 score for each criterion (5 = excellent fit). Multiply by the suggested weight to compute a weighted score.

Decision worksheet

* Superset can be excellent for governance if you invest in configuration, SSO, and hardening.

Tip: In real life, weights drive the outcome. If AI and Fabric matter, Power BI often wins. When data sovereignty and extensibility matter, Superset leads. However, when ad-hoc visual discovery is key, Tableau tends to top the list.

Recommended next steps (how Andolasoft can help)

  • Solution discovery workshop (2–3 weeks): Architecture mapping, data source inventory, governance model, and rapid POC in your preferred tool.
  • Pilot implementation: One high-value dashboard end-to-end (ingest → model → govern → publish), with CI/CD and cost telemetry.
  • Migration playbook: If you’re switching tools, we build a content inventory, semantic mapping, and automated testing harness for safe cutover.
  • Managed enablement: Training for creators/explorers, governance council setup, and a Center of Excellence playbook.

Want a hands-on assessment tailored to your stack? Andolasoft can architect and implement Superset, Power BI, or Tableau—including hybrid approaches that leverage your existing investments.

FAQs

Q1. Which tool is most cost-effective for 1,000 viewers and 50 creators?

If you’re already on Microsoft 365 and Azure, Power BI often yields the best per-user economics — especially if you can confine premium workloads to PPU or a single capacity. Tableau can be costlier for Creators but may reduce analysis time. Superset avoids license fees but requires platform engineering and ongoing ops.

Q2. Do I need Microsoft Fabric to use Power BI?

No. You can use Power BI with many data sources. However, Fabric unifies ingestion, storage, and modeling (e.g., Direct Lake) and streamlines operations—so many enterprises adopt it for scale and governance.

Q3. Can Apache Superset meet enterprise security requirements?

Yes — with the right hardening. Superset provides role-based security via Flask AppBuilder and a production security guide (v4+). You’ll need to implement SSO, secret management, and infra best practices.

Q4. What are current Power BI and Tableau prices?

Microsoft lists Power BI Pro at $14 and PPU at $24 per user/month (as of Apr 1, 2025; Premium capacity separate). Tableau uses role-based pricing (Creator/Explorer/Viewer) with commonly referenced figures of $75/$42/$15 per user/month billed annually (verify your quote and region).

Q5. Which tool is best for embedded analytics?

All three support embedding. Superset is attractive for internal app embedding in engineering-heavy orgs; Power BI and Tableau provide commercial-grade embedding SDKs supported by their broader ecosystems.

Q6. We’re a public sector/regulated enterprise — what’s safer?

If you require on-prem, consider Tableau Server or self-hosted Superset. If cloud is acceptable under your regulator, Power BI (with tenant and capacity controls) can meet stringent compliance regimes.

Conclusion: Matching the tool to your enterprise DNA

  • Pick Power BI if your business is already invested in Microsoft and wants AI-assisted analytics with unified Fabric data operations and strong governance.
  • Choose Tableau if your analytics success depends on speed of insight, story-driven dashboards, and you want proven governance models with flexible deployment.
  • Go with Apache Superset if you value open-source control, cost efficiency, and custom embedding, and you have the engineering strength to own the platform.

Most large enterprises end up multi-tool (e.g., Power BI for governed reporting + Tableau for storytelling; or Superset embedded in custom portals). The win is a governed data foundation, a clear RACI for content creation, and automation that keeps data fresh and trustworthy.

How to Leverage Superset for Scalable and Customizable Data Analytics

In today’s digital world, data isn’t just valuable—it’s essential. But having data is only half the battle. The real advantage comes from being able to understand it, visualize it, and act on it quickly.

That’s where Apache Superset steps in.

At Andolasoft, we help businesses unlock the full potential of Superset through our enterprise-grade Superset BI Services. Whether you’re a startup or a large organization, Superset makes it easier to scale your analytics and tailor insights to your exact needs, without the high costs of traditional BI tools.

Here’s how you can make the most of Superset to drive smarter decisions.

Why Superset?

Apache Superset is a modern, open-source platform that helps you explore data, build dashboards, and uncover insights without needing to write complex code. It’s lightweight, fast, and incredibly powerful.

And the best part? It’s free to use with no licensing fees.

Let’s dive into how you can use Superset to power your data strategy.

Say Goodbye to Expensive Licensing

Superset is completely open-source, which means you don’t pay hefty subscription fees like you would with other BI platforms. You maintain full control of your data and infrastructure—no vendor lock-in.

At Andolasoft, we offer full support and customization without any restrictions, so you can focus on what matters: making better business decisions.

Jumpstart Analytics with 200+ Ready Dashboards

Why start from scratch?

We provide over 200 pre-built dashboards covering core business areas like sales, marketing, finance, HR, and operations. These dashboards help your teams track key metrics instantly—no waiting, no guesswork.

You can use them as-is or customize them to fit your specific goals.

Real-Time Reporting for Real-Time Decisions

Forget about outdated reports and delayed updates.

With Superset, your dashboards refresh automatically with live data. This means you can monitor performance in real time and take action as soon as something changes—whether it’s a drop in sales, a spike in website traffic, or an operational bottleneck.

Faster insights lead to faster decisions.

Connect All Your Tools in One Place

Superset connects to over 60 different data sources. From databases and spreadsheets to CRMs and cloud apps, you can bring all your data together for a unified view.

Some popular integrations include

  • Salesforce, Zoho CRM, and HubSpot
  • Google Ads, Facebook Ads, and Mailchimp
  • QuickBooks, Xero, and Stripe
  • MySQL, PostgreSQL, Oracle, and more

This seamless integration makes it easier to see the full picture of your business.

Embed Dashboards Wherever You Need

Superset makes it easy to embed dashboards directly into your existing tools—whether it’s your internal portal, a customer app, or a SaaS product.

This means

  • Your team can access insights without switching platforms
  • Clients can view personalized data securely
  • Everyone stays informed, right within their workflow

Powerful Visualizations That Tell a Story

Superset offers a wide range of visual tools to make your data easier to understand. Whether you’re looking at customer journeys, performance trends, or geographic insights, there’s a visualization for it.

Some popular chart types include

  • Heatmaps
  • Treemaps
  • Funnels
  • Sankey diagrams
  • Time series and geo maps

These visuals help turn complex numbers into clear, meaningful insights.

Built to Scale with Enterprise Security

Superset is designed to grow with your business.

Our Superset BI Services include:

  • Secure login options like SSO and OAuth2
  • Role-based access controls for teams
  • Support for Docker and Kubernetes for large deployments
  • Compliance-ready features for HIPAA, GDPR, and more

You get a robust, secure BI setup that scales with your needs.

Where Superset Makes an Impact

Superset BI Services work across a variety of industries:

  • Healthcare: Track patient outcomes and appointment efficiency while staying HIPAA-compliant
  • Retail: Monitor sales, inventory, and marketing performance in real-time
  • Finance: Detect fraud, manage risk, and ensure compliance
  • Tech & SaaS: Analyze product usage, customer engagement, and client dashboards
  • Education & Government: Track resources, performance, and public-facing data
  • Construction: Monitor costs, track materials, and improve safety oversight

No matter your industry, Superset adapts to your specific goals.

Why Choose Andolasoft?

At Andolasoft, we go beyond just deploying tools. We help you build a complete, scalable BI solution with:

  • Expert setup and configuration
  • End-to-end support—from data connections to dashboard design
  • Custom development to match your branding and functionality
  • Flexible models that work for startups, SMEs, and large enterprises

We make Superset enterprise-ready and easy to use.

Ready to Get Started?

If you’re looking to modernize your data analytics without the high costs, Superset BI Services by Andolasoft is the solution.

  • Explore our gallery of 200+ dashboards
  • See real-time examples in action
  • Book a free consultation with our experts today

Open-source analytics. Enterprise power. Zero compromise.

Top 7 Benefits of Using Superset Dashboards for Real-Time Data Visualization

In today’s fast-evolving digital landscape, data isn’t just an asset—it’s the heartbeat of every successful business. To stay competitive, organizations need powerful, flexible tools that turn raw data into actionable insights quickly and accurately.

At Andolasoft, we deliver just that with Superset BI Services—an enterprise-grade business intelligence platform built on Superset BI. Combining cutting-edge features with seamless integrations and zero licensing fees, Superset BI Services empower businesses to visualize, analyze, and act on data like never before.

Let’s explore the top 7 benefits of Superset BI Services and why it’s the future of real-time data visualization for enterprises across industries.

No Expensive Licensing Fees — Enterprise Support

Why pay a premium for BI software when you can leverage the power of Apache Superset without vendor lock-in? Superset BI Services eliminates costly licensing fees and delivers a fully supported, scalable BI platform.

  • Save on upfront and recurring costs
  • Enjoy full customization without restrictions
  • Maintain total control over your analytics stack

This means faster ROI and freedom to innovate without being tied to expensive proprietary tools.

200+ Ready-to-Use Dashboards—Accelerate Time-to-Insight

Jumpstart your analytics with over 200 pre-built dashboards tailored for key departments and business functions: sales, marketing, finance, HR, operations, and more.

  • Instantly monitor vital KPIs
  • Easily customize dashboards to your needs
  • Empower every team to make data-driven decisions

Whether you’re tracking monthly recurring revenue, campaign performance, or operational efficiency, our dashboards help you get insights fast.

Real-Time Reporting — Live Data, Smarter Decisions

With Superset BI Services, say goodbye to stale reports. Our dashboards auto-refresh with live data, so you always work with the most accurate, up-to-the-minute information.

  • Detect trends and anomalies as they happen
  • Respond faster to market changes and operational issues
  • Confidently support strategic and tactical decisions

This dynamic reporting capability is a game-changer for fast-paced industries like SaaS, retail, and finance.

Connect to 60+ Data Sources — Unified, Cross-Platform Analytics

Superset BI Services integrates with an extensive array of data sources to give you a consolidated view of your business.
Key compatible platforms include:

  • CRM & Sales: Salesforce, Zoho CRM, HubSpot, CRMLeaf
  • Marketing: Google Ads, Facebook Ads, Mailchimp
  • Finance: QuickBooks, Xero, Stripe
  • HR: BambooHR, Zoho People, Workday
  • Project Management: Jira, Asana, Trello, Orangescrum
  • Chat & Collaboration: Slack, Microsoft Teams, Discord, Mattermost, Rocket.Chat, Chatwork
  • Databases: MySQL, PostgreSQL, Oracle, SQL Server
  • Files: Excel, CSV, JSON
  • Custom Applications: REST APIs for flexible data ingestion

This seamless connectivity lets you merge, enrich, and analyze data across tools, enabling powerful, data-driven decision-making.

Embed Dashboards Anywhere — Insights in Your Workflow

Bring the power of Superset dashboards directly into your apps, portals, or intranet platforms with secure and customizable embedding.

  • Enhance your SaaS product with embedded analytics
  • Deliver role-based views to internal teams or clients
  • Ensure consistent, branded reporting experiences

This approach improves adoption and puts critical insights exactly where your users need them.

Advanced Visualizations—From Basics to Cutting-Edge

Superset BI Services supports a rich visual toolkit to tell your data’s story clearly and compellingly.

  • Heatmaps for density and trend analysis
  • Treemaps to visualize hierarchical data
  • Sankey Diagrams to map flows and conversions
  • Geo Maps, Time Series, Funnels, KPI Charts, and more

These visuals help simplify complex data and enable deeper, more intuitive analysis across your teams.

Enterprise-Grade Scalability & Security — Built for Growth

Superset BI Services meet the demanding needs of modern enterprises with features including

  • Role-Based Access Control (RBAC)
  • SSO, OAuth2, LDAP integration
  • Asynchronous query processing via Celery
  • Docker & Kubernetes deployment for scalability
  • Full audit logging and compliance support (HIPAA, GDPR)

This ensures your BI infrastructure is secure, scalable, and compliant with industry regulations.

Industry Applications of Superset BI Services

Superset BI Services delivers tailored solutions across diverse industries:

Industry Applications of Superset BI Services

Why Choose Superset BI Services by Andolasoft?

At Andolasoft, we’re not just deploying BI tools—we’re transforming how you interact with data.

  • Deep expertise in Apache Superset and enterprise BI
  • End-to-end service from data integration to dashboard design
  • Flexible engagement models for businesses of all sizes
  • Commitment to delivering measurable business outcomes

Ready to Harness the Power of Real-Time BI?

Discover the difference Superset BI Services by Andolasoft can make in your data strategy:

  • Explore our live dashboard gallery with 200+ interactive examples
  • Schedule a free consultation with our Superset experts
  • Start transforming your data into your most valuable asset

Superset BI Services by AndolasoftSmart. Scalable. Enterprise-Ready