Top 10 Differences Between BI & Data Analytics

In today’s data-driven economy, organizations generate more data than ever before. According to industry research, enterprises analyze less than 30% of the data they collect, leaving valuable insights untapped. This challenge has made analytics-driven decision-making a boardroom priority.

However, one critical confusion persists across leadership teams: BI vs Data Analytics. While these terms are often used interchangeably, they serve distinct business purposes, operate at different levels of maturity, and answer fundamentally different questions.

Understanding the difference between BI vs Data Analytics is no longer optional. For CTOs, founders, and product leaders, this clarity directly impacts investment decisions, platform selection, team structure, and long-term scalability.

In this blog, you’ll learn the top 10 differences between BI vs Data Analytics, real-world use cases across industries, best practices for implementation, and how organizations can combine both for maximum impact. You’ll also see how Andolasoft, with deep expertise in BI, AI, machine learning, and data analytics, helps businesses design future-ready data ecosystems that drive measurable outcomes.

Top 10 Differences Between BI and Data Analytics

Business Need & Importance of Understanding BI vs Data Analytics

Modern organizations operate in an environment defined by speed, competition, and constant change. As a result, leadership teams need accurate insights, predictive intelligence, and real-time visibility to stay ahead. This is where understanding BI vs Data Analytics becomes critical.

Why This Distinction Matters Today

Business Intelligence focuses on what has already happened, while Data Analytics goes further to explain why it happened and what is likely to happen next. Companies that fail to distinguish between the two often invest in tools that don’t align with their goals, resulting in low adoption and poor ROI.

Industry-Wide Challenges

  • Healthcare organizations struggle with historical reporting but need predictive analytics for patient outcomes and capacity planning.
  • eCommerce companies rely on BI dashboards for sales tracking but require advanced analytics for personalization and demand forecasting.
  • Logistics and supply chain firms need BI for operational visibility, yet analytics for route optimization and risk prediction.
  • Fintech and SaaS companies depend on BI for compliance reporting while using analytics for fraud detection and churn reduction.
  • Manufacturing enterprises use BI for production reporting and analytics for predictive maintenance.

Risks of Not Modernizing

Organizations that rely only on legacy BI or fragmented analytics face serious risks:

  • Delayed decision-making due to static reports
  • Revenue loss from missed predictive opportunities
  • Operational inefficiencies and higher costs
  • Poor customer experiences due to lack of personalization
  • Inability to scale analytics across teams

Therefore, businesses need strategic, integrated data platforms instead of patchwork tools. This is where a trusted technology partner like Andolasoft plays a vital role in aligning BI vs Data Analytics with business objectives.

Top 10 Differences Between BI vs Data Analytics

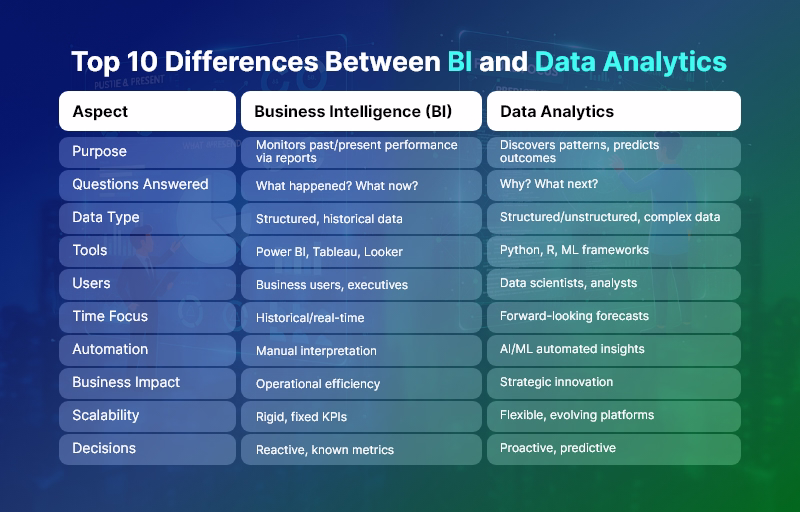
1. Purpose and Core Objective

  • Business Intelligence (BI) primarily focuses on monitoring past and present performance through dashboards, KPIs, and standardized reports.
  • Data Analytics, on the other hand, aims to discover patterns, uncover root causes, and predict future outcomes using advanced analytical techniques.

2. Type of Questions Answered

  • BI answers “What happened?” and “What is happening now?”, enabling descriptive insights.
  • Data Analytics answers “Why did it happen?” and “What will happen next?”, enabling diagnostic and predictive insights.

3. Data Complexity and Depth

  • BI works best with structured, clean, and historical data from data warehouses.
  • Data Analytics handles large, complex, and unstructured datasets, including logs, text, IoT data, and behavioral data.

4. Tools and Technologies Used

  • BI relies on tools like Power BI, Tableau, Looker, and Superset for visualization and reporting.
  • Data Analytics uses Python, R, SQL, Spark, ML frameworks, and AI models for deep analysis.

5. User Base and Skill Requirements

  • BI is designed for business users, executives, and operational teams with minimal technical skills.
  • Data Analytics is driven by data analysts, data scientists, and engineers with strong statistical and programming expertise.

6. Time Orientation

  • BI is historical and real-time, focusing on trends and current performance.
  • Data Analytics is forward-looking, emphasizing forecasting, simulation, and optimization.

7. Level of Automation

  • BI dashboards require manual interpretation and predefined metrics.
  • Data Analytics enables automated insights, anomaly detection, and recommendations through AI and ML.

8. Business Impact Scope

  • BI supports operational efficiency and management reporting.
  • Data Analytics drives strategic transformation, innovation, and competitive advantage.

9. Scalability and Flexibility

  • BI solutions are often rigid, built around fixed KPIs.
  • Data Analytics platforms are highly scalable and flexible, evolving with business needs.

10. Decision-Making Power

  • BI enables reactive decision-making based on known metrics.
  • Data Analytics empowers proactive and predictive decision-making with higher accuracy.

Best Practices, Frameworks & Actionable Tips for BI vs Data Analytics

Step-by-Step Recommendations

  • Define business objectives first, then decide whether BI, Data Analytics, or both are required.
  • Establish a single source of truth using centralized data warehouses or data lakes.
  • Adopt modular architectures that allow BI and analytics to coexist seamlessly.

Best Practices

  • Standardize KPIs for BI to ensure consistency across teams and departments.
  • Invest in data quality and governance, as analytics accuracy depends on clean data.
  • Enable self-service BI while maintaining controlled access to advanced analytics.

Frameworks & Architectures

  • Modern Data Stack (ETL/ELT, cloud data warehouse, BI layer, analytics layer).
  • Lakehouse Architecture for combining BI reporting and advanced analytics.
  • MLOps frameworks to operationalize analytics models at scale.

Do’s and Don’ts

  • Do align BI dashboards with business outcomes, not vanity metrics.
  • Do not overcomplicate BI with unnecessary analytics models.
  • Avoid siloed tools that prevent data sharing across teams.

Quick Wins

  • Automate recurring BI reports to save time.
  • Introduce predictive analytics for high-impact use cases like churn or demand forecasting.

How Andolasoft Helps

Andolasoft enables organizations to implement BI vs Data Analytics effectively through:

  • Custom Web & Mobile Development for analytics-driven applications
  • SaaS Product Engineering with embedded BI and analytics
  • BI, AI & Machine Learning Solutions for predictive intelligence
  • Data Analytics & Application Modernization for legacy systems
  • DevOps, Cloud & Automation for scalable performance

Choosing Andolasoft ensures faster implementation, lower risk, and measurable business value.

Customer Success

For example, a mid-sized healthcare SaaS provider, partnered with Andolasoft to modernize its reporting and analytics platform. Initially, the company relied solely on BI dashboards to track patient engagement and operational metrics.

Andolasoft implemented a unified BI vs Data Analytics solution, combining real-time dashboards with predictive analytics models. Within four months, achieved:

  • 35% faster reporting cycles
  • 25% reduction in operational inefficiencies
  • Improved patient outcome predictions by 40%
  • Higher adoption of analytics across leadership teams

By integrating BI for visibility and Data Analytics for prediction, transformed decision-making from reactive to proactive.

Key Takeaways & Closing

Understanding the difference between BI vs Data Analytics is essential for modern businesses.

  • BI delivers clarity on past and present performance.
  • Data Analytics unlocks predictive and prescriptive intelligence.
  • Together, they create a powerful foundation for data-driven growth.

Organizations that adopt both strategically gain better visibility, smarter decisions, and sustainable competitive advantage. With the right partner, businesses can avoid common pitfalls and maximize ROI.

Andolasoft brings proven expertise in BI vs Data Analytics, helping organizations design, build, and scale intelligent data solutions that drive real outcomes.

FAQs

1. What is the main difference between BI vs Data Analytics?

BI focuses on historical reporting and dashboards, while Data Analytics emphasizes predictive and diagnostic insights using advanced techniques.

2. Can BI and Data Analytics work together?

Yes. Combining BI vs Data Analytics enables organizations to track performance and predict future outcomes effectively.

3. Which is better for executives: BI or Data Analytics?

Executives typically rely on BI for quick insights, while analytics supports strategic forecasting and long-term planning.

4. Is Data Analytics more expensive than BI?

Data Analytics often requires more skilled resources, but it delivers higher strategic value when implemented correctly.

5. Do small businesses need BI vs Data Analytics?

Yes. Even small businesses benefit from BI dashboards and targeted analytics for growth and efficiency.

6. How does Andolasoft help with BI vs Data Analytics?

Andolasoft designs end-to-end BI and analytics solutions, from data engineering to AI-driven insights.

7. When should a company move beyond BI to Data Analytics?

When businesses need forecasting, automation, and deeper insights beyond descriptive reporting, Data Analytics becomes essential.

Top 15 Benefits of Implementing a Self-Service BI Platform

Today, leaders across industries face a common challenge: business decisions must be faster, more data-driven, and more accurate than ever before. Yet most organizations still struggle with slow reporting cycles, fragmented data sources, and overloaded IT teams. This is where a Self-Service BI Platform creates real competitive advantage.

By empowering teams to independently access, analyze, and visualize data, businesses unlock agility, reduce bottlenecks, and drive high-velocity execution. Moreover, organizations embracing self-service analytics report 30–50% faster decision-making, according to several global BI studies.

In this blog, you’ll discover the top 15 benefits of implementing a Self-Service BI Platform, why it matters in today’s digital era, and how companies can adopt it effectively. You’ll also see how Andolasoft, with its proven expertise in BI, AI, machine learning, SaaS engineering, data analytics, and enterprise solutions, helps global brands transform their data capabilities.

Top 15 Benefits of a Self-Service BI Platform

Why Modern Businesses Need a Self-Service BI Platform

In most organizations, analytics has long been an IT-driven process. Departments rely on data teams to prepare reports, extract datasets, or build dashboards. This creates delays, limits innovation, and slows decision-making.

A Self-Service BI Platform resolves these gaps by democratizing access to insights. It enables business users — sales managers, finance teams, marketers, operations leaders, and product managers — to explore data on their own without technical dependencies.

Why It Matters Today

Modern industries — from healthcare and manufacturing to fintech and eCommerce — operate in fast-moving environments. Data volumes continue to explode, yet delayed insights cause missed opportunities. A Self-Service BI Platform resolves these challenges by:

  • Reducing the decision-making cycle from days to minutes by enabling users to generate reports on demand.
  • Aligning teams on real-time data rather than outdated spreadsheets or manual data pulls.
  • Cutting operational inefficiencies caused by poor data visibility or inconsistent reporting practices.

Industry Use Cases

A Self-Service BI Platform delivers measurable impact across sectors:

  • Healthcare: clinicians access real-time patient metrics, improving care delivery and operational planning.
  • Ecommerce: marketing and product teams monitor campaign performance, purchase behavior, and funnel drop-offs instantly.
  • Manufacturing: plant managers analyze downtime, production defects, and supply chain trends without waiting for IT support.
  • Fintech: regulatory, fraud, and transaction dashboards become self-operational, reducing compliance risks.
  • SaaS: product teams iterate faster using usage analytics, churn insights, and cohort reports.

Risks of Not Adopting Self-Service Analytics

Organizations that do not modernize continue to struggle with:

  • Long reporting delays that slow strategic decisions.
  • High dependency on IT, delaying innovation.
  • Data silos leading to inconsistent insights across teams.
  • Security vulnerabilities due to manual exports and spreadsheet sharing.
  • Revenue loss from inaccurate forecasting or delayed insights.

In a digital-first world, a Self-Service BI Platform is not a luxury—it is a foundational operational capability that enables enterprises to scale efficiently and securely.

Top 15 Benefits of Implementing a Self-Service BI Platform

Below are the most impactful advantages organizations gain when adopting a modern, enterprise-grade Self-Service BI Platform.

1. Faster Decision-Making Across Departments

A Self-Service BI Platform eliminates dependencies on IT teams, enabling business users to generate insights instantly. This results in significantly shorter decision cycles, faster approvals, and quicker execution across sales, finance, supply chain, and operations.

2. Reduced IT Workload & Operational Bottlenecks

IT teams often spend 40–60% of their workload on routine reporting tasks. By shifting routine analytics to end-users, a Self-Service BI Platform frees technical teams to focus on strategic initiatives like automation, modernization, or AI implementation.

3. Unified Data Visibility Across the Organization

Self-service BI brings every department onto a centralized data platform, ensuring everyone works with the same numbers. This promotes alignment, reduces conflicts, and eliminates discrepancies in decision-making.

4. Improved Data Accuracy & Governance

With automated pipelines, role-based access, and standardized dashboards, organizations greatly reduce errors caused by spreadsheets, manual consolidation, and outdated reports.

5. Empowered Business Users and Greater Ownership

Teams that can explore their own data develop deeper analytical thinking and take more ownership of KPIs. This creates a performance-driven culture where insights drive action.

6. Real-Time Reporting and Live Dashboards

Traditional BI usually relies on static reports. A Self-Service BI Platform enables dynamic dashboards that refresh automatically, ensuring real-time visibility into KPIs, customer behavior, and operational metrics.

7. Enhanced Collaboration Between Technical and Business Teams

With self-service analytics, business teams independently generate insights while IT teams focus on data quality, security, and architecture. This leads to stronger collaboration and better alignment.

8. Lower Operational Costs

By automating reporting workflows and reducing manual effort, organizations often reduce analytics costs by 25–40%. The Self-Service BI Platform becomes an engine for efficiency and resource optimization.

9. Discovery of New Insights & Opportunities

Self-service exploration encourages curiosity and experimentation. Teams uncover patterns, root causes, and opportunities that would otherwise remain hidden in data silos.

10. Scalability for Growing Teams & Data Volumes

Self-service BI tools are built for scale. As new departments, markets, or product lines are added, the platform can easily expand without architectural bottlenecks.

11. Stronger Data Security Through Centralized Access Controls

A Self-Service BI Platform reduces risk by eliminating unsecured spreadsheets and enabling enterprise-grade permissions, encryption, and audit trails.

12. Automation of Repetitive Analytics Tasks

Scheduled reports, automated alerts, and prebuilt dashboards minimize manual effort. Teams always have updated insights without repetitive data pulls.

13. Better Customer Experience Through Faster Insights

Modern businesses rely heavily on customer analytics. Self-service BI enables rapid insight into churn, retention, behavior, and personalization opportunities.

14. Improved Forecasting and Strategic Planning

With real-time access to historical and current data, leadership teams produce more accurate forecasts, financial models, and growth strategies.

15. Higher Organizational Agility and Competitive Advantage

Ultimately, a Self-Service BI Platform enables companies to react faster, innovate more confidently, and stay ahead of competition by making decisions powered by real-time intelligence.

Best Practices for Implementing a Self-Service BI Platform

Success with self-service analytics requires thoughtful strategy, process alignment, and the right technology foundation. Below are actionable best practices and frameworks.

1. Establish Clear Data Ownership

Define who manages data quality, governance, and access. Clear roles prevent duplication, data drift, or inconsistent definitions.

2. Build a Centralized Data Architecture

Consolidate sources into a unified data warehouse or lakehouse. This ensures reliability, consistency, and scalability for high-volume analytics.

3. Choose a Flexible, Scalable BI Toolset

Evaluate tools based on visualization capabilities, governance, performance, security, and integration ease.

4. Implement Role-Based Access Controls

Ensure users only access relevant datasets. This protects sensitive information while enabling broad adoption.

5. Standardize Dashboards & Metrics

Create a universal KPI library so every team uses the same definitions for revenue, churn, conversion, utilization, and performance.

6. Enable Training & Upskilling for Non-Technical Teams

Provide training programs on data literacy, dashboard building, and analytics best practices.

7. Use Automation Wherever Possible

Automate ETL pipelines, alerts, data quality checks, and scheduled reporting.

8. Monitor Usage & Continuously Improve

Review dashboard adoption, usage statistics, load times, and user feedback to refine BI strategy.

How Andolasoft Helps Companies Build a Powerful Self-Service BI Platform

Andolasoft provides end-to-end BI and analytics expertise across:

We design scalable, secure, and intuitive BI environments that empower business users while maintaining enterprise governance.

Case Study

For example, a mid-sized transportation provider, partnered with Andolasoft to build a BI Platform that unified data from fleet systems, driver apps, billing tools, and telematics. Within 10 weeks, the company achieved:

  • 40% faster operational decisions due to real-time dashboards.
  • 30% reduction in manual reporting efforts, freeing teams for revenue-generating activities.
  • Enhanced route optimization, reducing fuel costs by nearly 18%.

Here’s what changed: managers gained instant access to KPIs, predictive insights improved planning, and operational bottlenecks reduced significantly.

Key Takeaways

A Self-Service BI Platform is no longer optional—it is essential for modern, data-driven enterprises. The most important insights include:

  • It accelerates decision-making and reduces IT dependency.
  • It creates real-time, unified visibility across the organization.
  • It boosts efficiency, accuracy, governance, and competitive advantage.
  • It empowers teams to innovate, experiment, and take ownership of outcomes.

Organizations implementing a Self-Service BI Platform today position themselves for long-term scalability, efficiency, and digital transformation.

FAQs

1. What is a Self-Service BI Platform?

It is a modern analytics system that enables non-technical users to access, explore, and visualize data independently, without relying on IT teams.

2. Why do businesses need a Self-Service BI Platform?

It improves decision-making speed, reduces bottlenecks, eliminates data silos, and empowers teams to work with accurate data in real time.

3. Is a the BI Platform secure?

Yes. These platforms use role-based permissions, audit trails, encryption, and centralized governance to ensure data protection.

4. How long does implementation typically take?

Depending on the complexity, implementation can take 4–12 weeks with proper planning, architecture setup, and user onboarding.

5. What industries benefit most from a BI Platform?

Healthcare, eCommerce, fintech, manufacturing, logistics, SaaS, retail, and education all gain substantial advantages from real-time analytics.

6. Does Andolasoft build custom BI solutions?

Absolutely. Andolasoft specializes in end-to-end BI engineering, AI-driven analytics, ML models, SaaS development, and enterprise-grade data platforms.

7. Can a Self-Service BI Platform integrate with existing systems?

Yes, modern BI tools integrate seamlessly with CRMs, ERPs, SaaS apps, databases, cloud systems, and third-party APIs.

Top BI Challenges Businesses Face and How to Solve Them?

Business Intelligence (BI) has become a mission-critical function for modern organizations. Leaders want to make faster, data-backed decisions while teams need real-time visibility into performance, market trends, and operational gaps.

However, leveraging BI isn’t always straightforward. Many businesses invest in BI tools but struggle to actually translate data into meaningful outcomes.

In this guide, we uncover the most common BI challenges businesses face and practical solutions to overcome each, so your BI initiative doesn’t just generate dashboards, but drives profitability and strategic growth.

Top BI Challenges & How to Solve Them

Why Business Intelligence Often Fails: The Real Issue

Even with powerful BI tools available today, success often stalls because teams:

  • Don’t know what data is truly valuable
  • Face data accuracy or silo problems
  • Lack BI adoption across business units
  • Fail to align BI with business strategy

The good news? All these challenges are fixable.

Let’s dive into the 10 biggest BI challenges, and how to solve them effectively.

Top 10 BI Challenges and How to Solve Them

  • Data Silos and Lack of Integration

The challenge:

Data lives across multiple systems — CRM, ERP, spreadsheets, marketing tools, and more — making analytics difficult.

The solution:

  • Implement a unified data pipeline
  • Use ETL (Extract, Transform, Load) automation
  • Integrate systems via modern APIs
  • Adopt a centralized data warehouse or lakehouse

Outcome → Single source of truth that improves accuracy and data accessibility.

  • Poor Data Quality

Bad data leads to bad decisions.

Common issues:

  • Duplicates
  • Missing fields
  • Outdated records
  • Inconsistent formats

Solution strategies:

  • Automated data cleaning and validation
  • Data governance policies
  • Master data management (MDM)

Outcome → Trusted data + confident decision making.

  • Low BI Adoption Among Users

Most employees still rely on Excel and intuition — not insights.

Why adoption fails:

  • Tools are too complex
  • Limited training
  • Dashboards don’t solve real problems

How to fix it:

  • Provide intuitive self-service BI tools
  • Build role-specific dashboards
  • Offer guided onboarding and training

Outcome → BI becomes everyone’s habit — not a reporting chore.

  • Slow and Inefficient Reporting

When dashboards take minutes to load, users abandon BI.

Key improvement tactics:

  • Optimized data models
  • In-Memory analytics
  • Incremental refresh instead of full loads
  • Scalability planning

Outcome → Insights available instantly when decisions are needed.

  • Lack of Clear KPIs and Strategy

Without defined business goals, BI becomes random reporting.

How to solve:

  • Start BI with business questions
  • Identify measurable KPIs linked to goals
  • Create data-driven success benchmarks

Outcome → BI aligns directly with growth initiatives and ROI.

  • Security, Compliance & Access Control Issues

Data breaches or unauthorized access can be devastating.

Fix it with:

  • Robust role-based access permissions
  • Encryption in transit and at rest
  • Audit logs and compliance frameworks
  • Regular security governance reviews

Outcome → Secure analytics trusted by leadership and IT.

  • Real-Time Data Not Available

Outdated data = outdated decisions.

How to solve:

  • Use streaming analytics where needed
  • Implement CDC (Change Data Capture)
  • Automate refresh cycles

Outcome → Operational agility and faster risk mitigation.

  • High Cost of BI Implementation

Licensing + integrations + skilled resources = $$$

Cost optimization solutions:

  • Cloud-first BI deployment
  • Scale licensing as users grow
  • Use open-source or freemium BI tools initially
  • Focus on high-value use cases first

Outcome → Lower TCO (Total Cost of Ownership) without sacrificing capability.

  • Skills Gap in Data Literacy

BI software alone doesn’t create analysts.

Solve by:

  • Company-wide data literacy programs
  • Hands-on workshops on using dashboards
  • Embedded help within BI platforms

Outcome → Data becomes a culture, not a department.

  • Overwhelming Volume of Data

More data doesn’t mean better insights — often it’s the opposite.

How to fix:

  • Prioritize relevant data sources
  • Archive historical data strategically
  • Automate metadata management
  • Use AI to surface valuable patterns

Outcome → Right data → right insights → right actions.

Bonus: How to Ensure Long-Term BI Success

A successful BI transformation includes:

Pillar Practice
Strategy Align BI goals with business objectives
Technology Choose scalable BI tools with flexible integration
Governance Maintain data quality, security, and ownership
Skills Train users continuously
Culture Promote evidence-based decision making

BI success isn’t a one-time setup — it’s a continuous journey powered by adoption and improvement.

Conclusion

Business Intelligence can become an organization’s competitive advantage — but only when challenges like data quality, adoption, and integration are handled proactively.

By addressing these BI challenges strategically, businesses unlock:

  • Smarter decisions
  • Increased productivity
  • Reduced operational risks
  • Faster revenue growth

Start small. Focus on solving real business problems. And let data guide the future.

FAQs

1. What causes most BI failures?

Lack of adoption, poor data quality, and misaligned goals are the top reasons BI initiatives fail.

2. How can business intelligence drive ROI?

By improving decision-making, reducing errors, optimizing operations, and discovering revenue opportunities.

3. Which BI tools are most commonly used?

Tools like Power BI, Tableau, Qlik, Looker, and modern cloud-native BI platforms.

4. How do I improve BI adoption?

Deliver easy-to-understand dashboards and train users regularly.

5. What industries benefit most from BI?

Retail, manufacturing, finance, logistics, healthcare — and any data-driven business.

Managed Superset Hosting: Why Cloud-Based BI is a Game-Changer

Business Intelligence (BI) is no longer a luxury—it’s a necessity. As organizations become more data-driven, they need tools that offer speed, scalability, and simplicity. While Apache Superset is one of the most powerful open-source BI platforms available today, hosting and managing it in-house can be complex and time-consuming.

That’s where Managed Superset Hosting comes in.

By moving Superset to the cloud through a managed service provider like Andolasoft, businesses get all the power of Superset with none of the operational headaches. In this blog, we explore why cloud-based Superset hosting is a game-changer for modern enterprises and growing startups alike.

What is Managed Superset Hosting?

Managed Superset Hosting means running Apache Superset in a cloud environment, fully maintained by experts. This includes setup, configuration, performance optimization, scaling, updates, and security, so you can focus on analyzing data instead of managing infrastructure.

At Andolasoft, our Superset BI Services deliver a fully managed, enterprise-grade Superset environment with zero licensing fees and full technical support.

Why Cloud-Based BI is a Game-Changer

Zero Setup Hassles — Go Live Faster

Hosting Superset in the cloud means

  • No need to provision servers or install dependencies
  • No manual upgrades or patching
  • Instant availability of dashboards and analytics tools

You can go from zero to live BI dashboards in a matter of days, not weeks.

Scalability That Grows With You

Your BI platform should never slow you down. With managed hosting, Superset is deployed on a scalable cloud infrastructure that automatically adjusts to:

  • Increasing data volumes
  • More concurrent users
  • Complex analytics workloads

Whether you’re a startup or a growing enterprise, your Superset setup will scale seamlessly.

Enterprise-Grade Security and Compliance

Data security is non-negotiable. Managed Superset Hosting includes:

  • Encrypted data transfers (SSL/TLS)
  • Role-Based Access Control (RBAC)
  • SSO and LDAP integration
  • Audit logs and activity tracking
  • Compliance support (HIPAA, GDPR, SOC 2)

This ensures your business intelligence infrastructure stays secure and compliant without needing a dedicated security team.

24/7 Monitoring and Support

Downtime or performance lags can cost you business. With managed hosting, your Superset instance is

  • Monitored continuously for performance and uptime
  • Backed by a team of BI experts
  • Optimized for speed, reliability, and uptime

This means peace of mind and guaranteed availability, even during peak usage.

Connect to 60+ Data Sources, Instantly

With Andolasoft’s managed Superset hosting, you can plug into:

  • SQL databases (MySQL, PostgreSQL, Oracle, etc.)
  • Cloud data warehouses (BigQuery, Snowflake, Redshift)
  • Marketing and CRM tools (Google Ads, Salesforce, HubSpot)
  • Financial and HR systems (Stripe, QuickBooks, BambooHR)

No custom coding. No integration bottlenecks. Just seamless data access.

No Vendor Lock-In

Superset is open-source, and with managed hosting:

  • You maintain full control over your data and dashboards
  • You can export or migrate anytime
  • You’re not tied to a proprietary BI license model

This gives you freedom, flexibility, and future-proofing.

Embedded Dashboards, Anywhere You Need

Need to display Superset dashboards inside your SaaS product, internal portal, or customer reports?

Managed Supersets Hosting supports secure dashboard embedding, allowing you to

  • Provide real-time insights to your users
  • Create role-based reporting experiences
  • Deliver custom analytics in your workflow

This is perfect for product teams, client reporting, and embedded BI use cases.

Why Choose Andolasoft for Superset BI Hosting?

We’re not just hosting Superset—we’re optimizing it for performance, scale, and business outcomes.

  • Expert setup, support, and customizations
  • Scalable cloud infrastructure (Docker/Kubernetes)
  • Seamless integration with your data ecosystem
  • 200+ ready-to-use dashboards across industries
  • Flexible plans for startups and enterprises

Get Started in Days, Not Weeks

Ready to simplify your BI infrastructure and unlock powerful, real-time analytics?

  • Explore our live dashboard gallery
  • Book a free consultation with our Superset experts
  • Start your managed Superset journey with Andolasoft

Fully managed, scalable, yours.

Case Study: Driving Growth with Tailored Superset Dashboards in SaaS

In the fast-paced world of SaaS, data isn’t just a tool—it’s the growth engine. Understanding customer behavior, product usage, and financial performance in real-time can mean the difference between scaling successfully and missing opportunities.

But many SaaS companies struggle with disconnected data, limited visibility, and expensive BI tools that don’t adapt to their evolving needs.

That’s where Superset comes in.

At Andolasoft, we’ve helped several SaaS companies overcome these challenges by building tailored Apache Superset dashboards that deliver real-time, actionable insights—without breaking the bank. In this case study, we’ll explore how one such company transformed its analytics strategy and unlocked new growth using Superset BI Services.

The Challenge

A mid-sized SaaS company offering a subscription-based project management tool was facing major roadblocks:

  • Scattered data across multiple platforms: Stripe for billing, Google Analytics for web traffic, HubSpot for marketing, and PostgreSQL for product usage
  • Manual reporting with spreadsheets leads to slow, error-prone decision-making
  • Lack of visibility into critical KPIs like Monthly Recurring Revenue (MRR), churn rate, customer engagement, and feature adoption
  • The expensive BI tools they had tested failed to provide flexibility or scale cost-effectively

They needed a solution that was

  • Fast to deploy
  • Easy to customize
  • Capable of unifying multiple data sources
  • Scalable and secure

The Solution: Superset BI Services by Andolasoft

We partnered with the client to design and implement a custom Superset BI solution tailored specifically for their SaaS business model. Here’s how we made it work:

Unified Data Pipeline

Using Superset’s ability to connect to multiple data sources, we integrated

  • Stripe for subscription and payment data
  • PostgreSQL for application usage data
  • Google Analytics for website traffic insights
  • HubSpot for marketing campaign performance

This gave the client a single source of truth—no more switching tabs or pulling data manually.

Tailored KPI Dashboards

We created over 15 interactive dashboards tailored to their SaaS business. Key visualizations included:

  • MRR and ARR trends with breakdowns by region and customer segment
  • Customer churn and retention by cohort
  • Feature usage analytics to track which features were driving engagement
  • Funnel analysis from website visit to conversion
  • Marketing campaign ROI tied directly to product adoption

Each dashboard was designed with filters, drill-down options, and real-time updates to help teams dig into the data as needed.

Embedded Analytics for Leadership and Clients

Using Superset’s secure embedding features, we integrated dashboards into the company’s internal admin portal for:

  • Leadership and finance teams to review KPIs
  • Product teams track usage and feature adoption
  • Sales and success teams to monitor client behavior in real time

This ensured critical insights were available where and when they were needed.

Scalable, Secure, and Cost-Efficient

Thanks to Superset’s open-source architecture, we deployed a Dockerized, scalable BI environment without recurring licensing fees. We also implemented:

  • Role-Based Access Control (RBAC) for team-specific views
  • SSO integration for secure access
  • Audit logs for compliance

The result? A highly secure, future-ready analytics platform at a fraction of the cost of proprietary tools.

The Results

Within just 90 days, the company began seeing tangible benefits:

  • 30% faster decision-making across product and marketing teams
  • Real-time visibility into user engagement, enabling smarter feature rollouts
  • 20% reduction in churn, thanks to better tracking of user drop-off points
  • Elimination of spreadsheet-based reporting, saving hours of manual effort weekly
  • Zero added cost from BI licensing—allowing more investment in growth initiatives

Why Superset Works for SaaS

SaaS businesses live and breathe data, from customer acquisition to retention. Apache Superset, when tailored right, helps SaaS teams:

  • Visualize key SaaS metrics in real-time
  • Track product usage and feature adoption
  • Identify friction points in the customer journey
  • Improve cross-team collaboration with shared insights
  • Scale analytics affordably and securely

Ready to Transform Your SaaS Data Strategy?

At Andolasoft, we specialize in building scalable, secure, and customizable Superset dashboards that deliver measurable business outcomes.

  • Explore our live Superset dashboard gallery
  • Schedule a free strategy call with our Superset BI experts
  • Start turning your SaaS data into your biggest growth asset

SaaS analytics tailored. Growth unlocked.