Every manufacturing BI programme faces the same opening question: where do we start? Starting from a blank canvas means months of workshops before anyone sees a chart, and the first drafts inevitably reflect whoever shouted loudest rather than what the industry has already standardised. Starting from proven templates inverts the problem. The right KPIs, layouts, RAG thresholds and filters arrive on day one, and the workshops become a review exercise: confirm, adjust, connect to your data.
This article walks through a complete template library for Apache Superset that we use as the starting point for manufacturing clients: eight functional folders, roughly thirty dashboards, every KPI aligned to a recognised standard such as ISO 22400 for plant performance, SCOR for supply chain, ISO 9001 for quality, and GRI for sustainability reporting.
Why Start From a Template Library
- Faster time to value: a working dashboard in days, a full suite in weeks. The slow part of BI is agreeing on definitions, and templates arrive with defensible, standards-based definitions already written.
- Best practice baked in: each template encodes what world-class reporting looks like for its function, so you inherit the collective practice of an industry rather than reinventing it.
- Consistent design language: every template opens with a KPI band, then gauges, then trend and breakdown analysis, then a scorecard table. Users learn the grammar once and can read any dashboard in the suite.
- Standard filters: the same Date, Country, Business Unit, and Department filters appear everywhere, so any two views reconcile and cross-functional questions get answered without new extracts.
- Targets included: RAG thresholds ship with sensible industry defaults (OEE green at 75 percent and above, scrap red above 3.5 percent, and so on) and are adjusted to your targets during onboarding.
The Template Library at a Glance
| Folder / Template Set | Included Dashboards | Headline KPIs |
| Executive & Consolidated | CEO scorecard, global consolidated, country comparison, business-unit comparison | Revenue, EBITDA, cash, OEE, LTIFR, carbon intensity |
| Sales | Executive, manager, rep, product, forecast & pipeline, win/loss & velocity, customer & account | Win rate, weighted pipeline, coverage, NRR, book-to-bill |
| Finance & Risk | Finance performance, expense analysis, cash flow & leverage, risk & working capital | Margins, DSO, free cash flow, quick ratio, AR aging |
| Operations | Production (OEE), cost & flow, quality, procurement, asset reliability & maintenance | OEE, unit cost, six losses, CAPA, PM compliance |
| Services | Services performance, delivery & contracts | SLA, CSAT, utilization, realization, renewal |
| People (HR) | Human resources, workforce cost & talent | Attrition, eNPS, revenue per employee, diversity |
| Safety & Sustainability | HSE/safety, ESG environmental, ESG social & governance | LTIFR, TRIFR, Scope 1-3, ISO 45001 / 14001 |
| Supply Chain & Trading | Logistics, trading operations, trading risk & P&L | OTIF, freight per tonne, mark-to-market, VaR |
Inside the Operations Templates
Production / OEE Template (ISO 22400)
The anchor template. A twelve-tile KPI band covers output, plan attainment, OEE with its availability, performance and quality components, scrap and rework rates, downtime hours, MTBF, MTTR, and throughput. Below it: output versus plan trend, OEE decomposition by plant, planned-versus-unplanned downtime with a Pareto by reason, and plant and line scorecard tables with direction-aware RAG. This is the dashboard a plant head opens every morning. 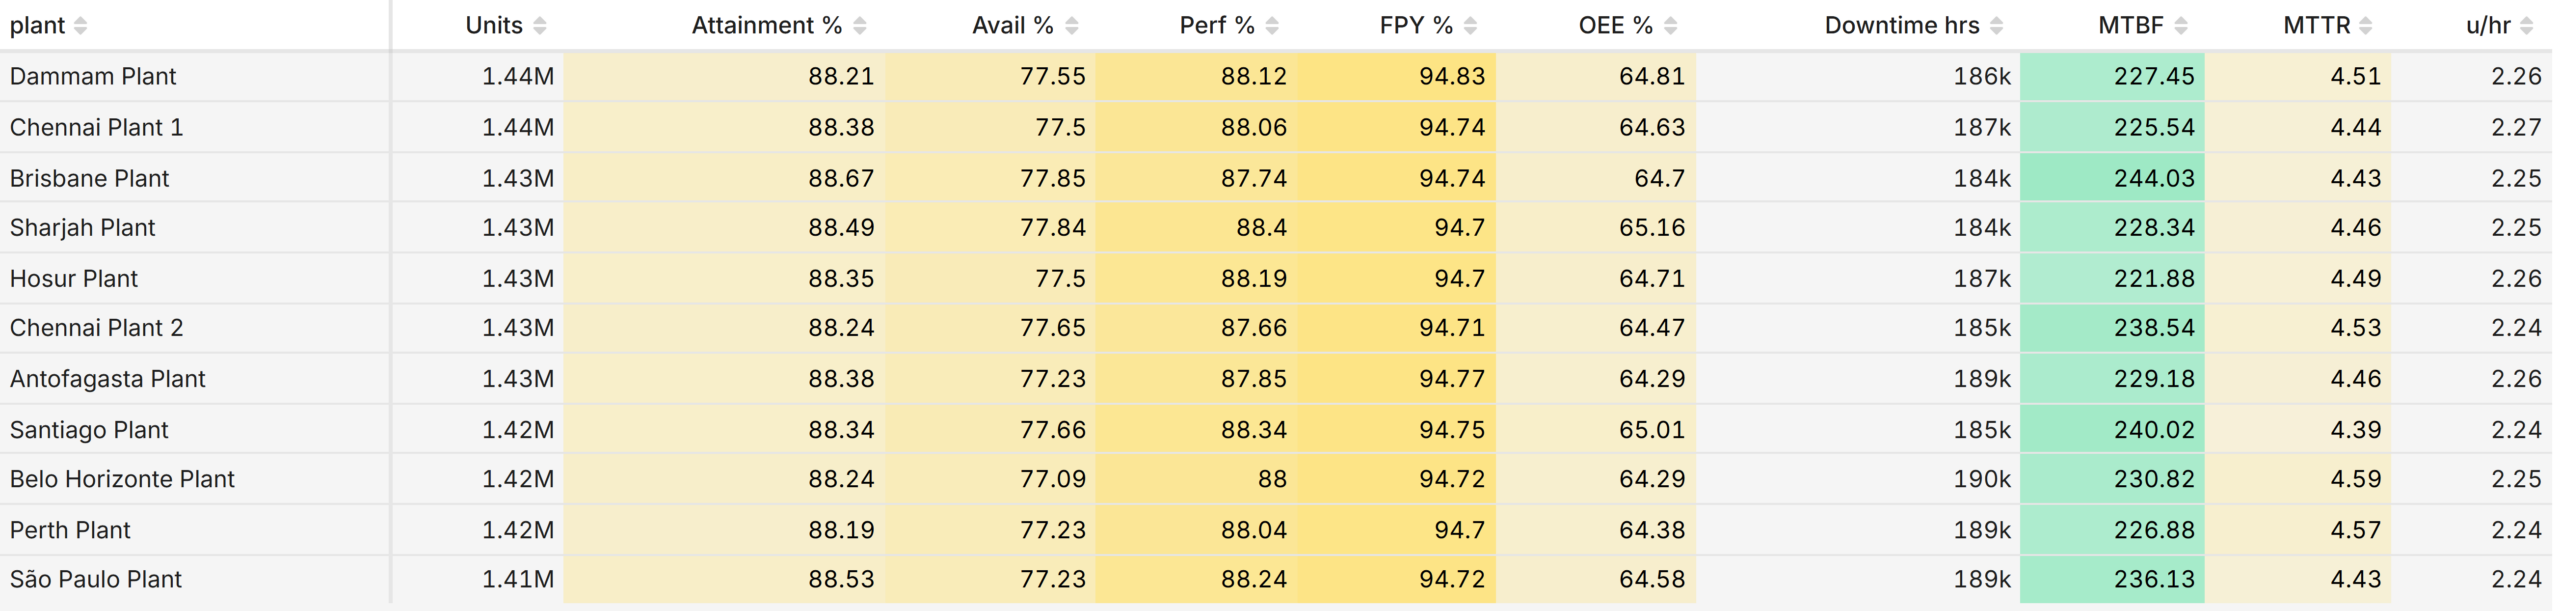
Cost & Flow Template (Lean / TPM)
OEE tells you how much you lost; cost and flow tell you what it cost and where the flow breaks. This template adds unit cost of production against standard cost with variance percentage, a stacked cost breakdown (material, labour, energy, overhead, cost of poor quality), the classic Six Big Losses by plant, cycle time against takt time, capacity utilization, work-in-progress, and on-time delivery. Together, the two templates turn a plant-efficiency board into a genuine operations board. 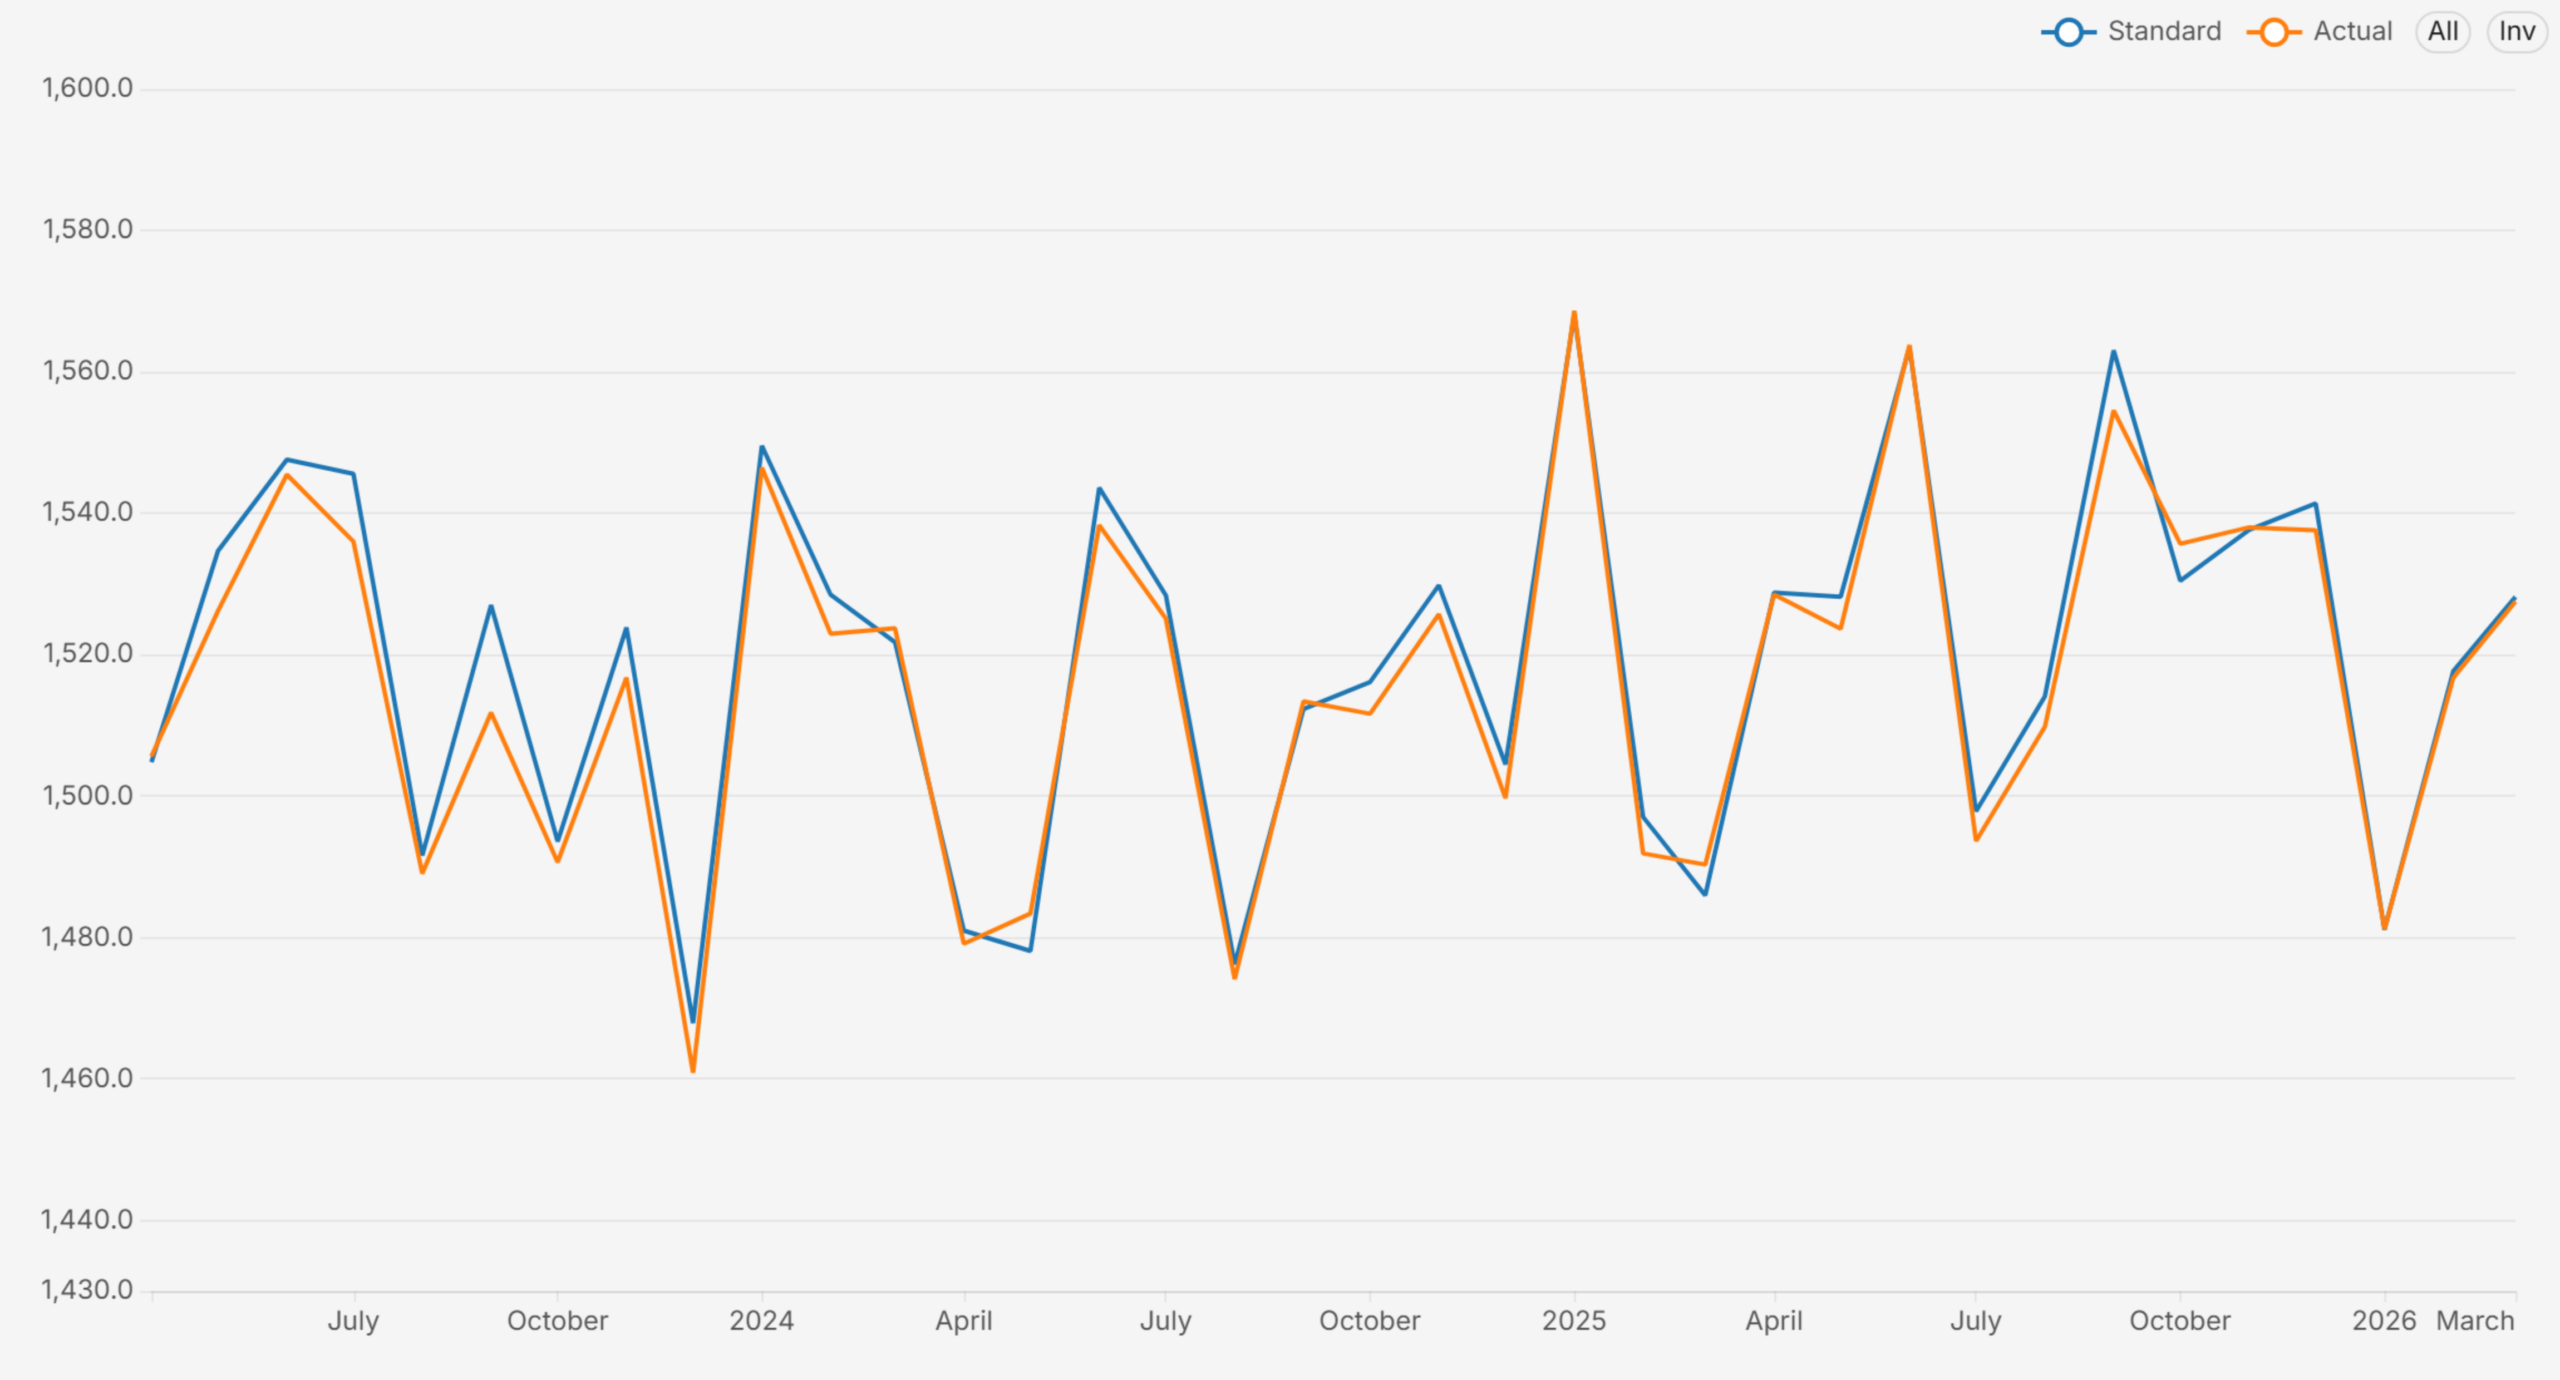
Quality, Procurement and Maintenance Templates
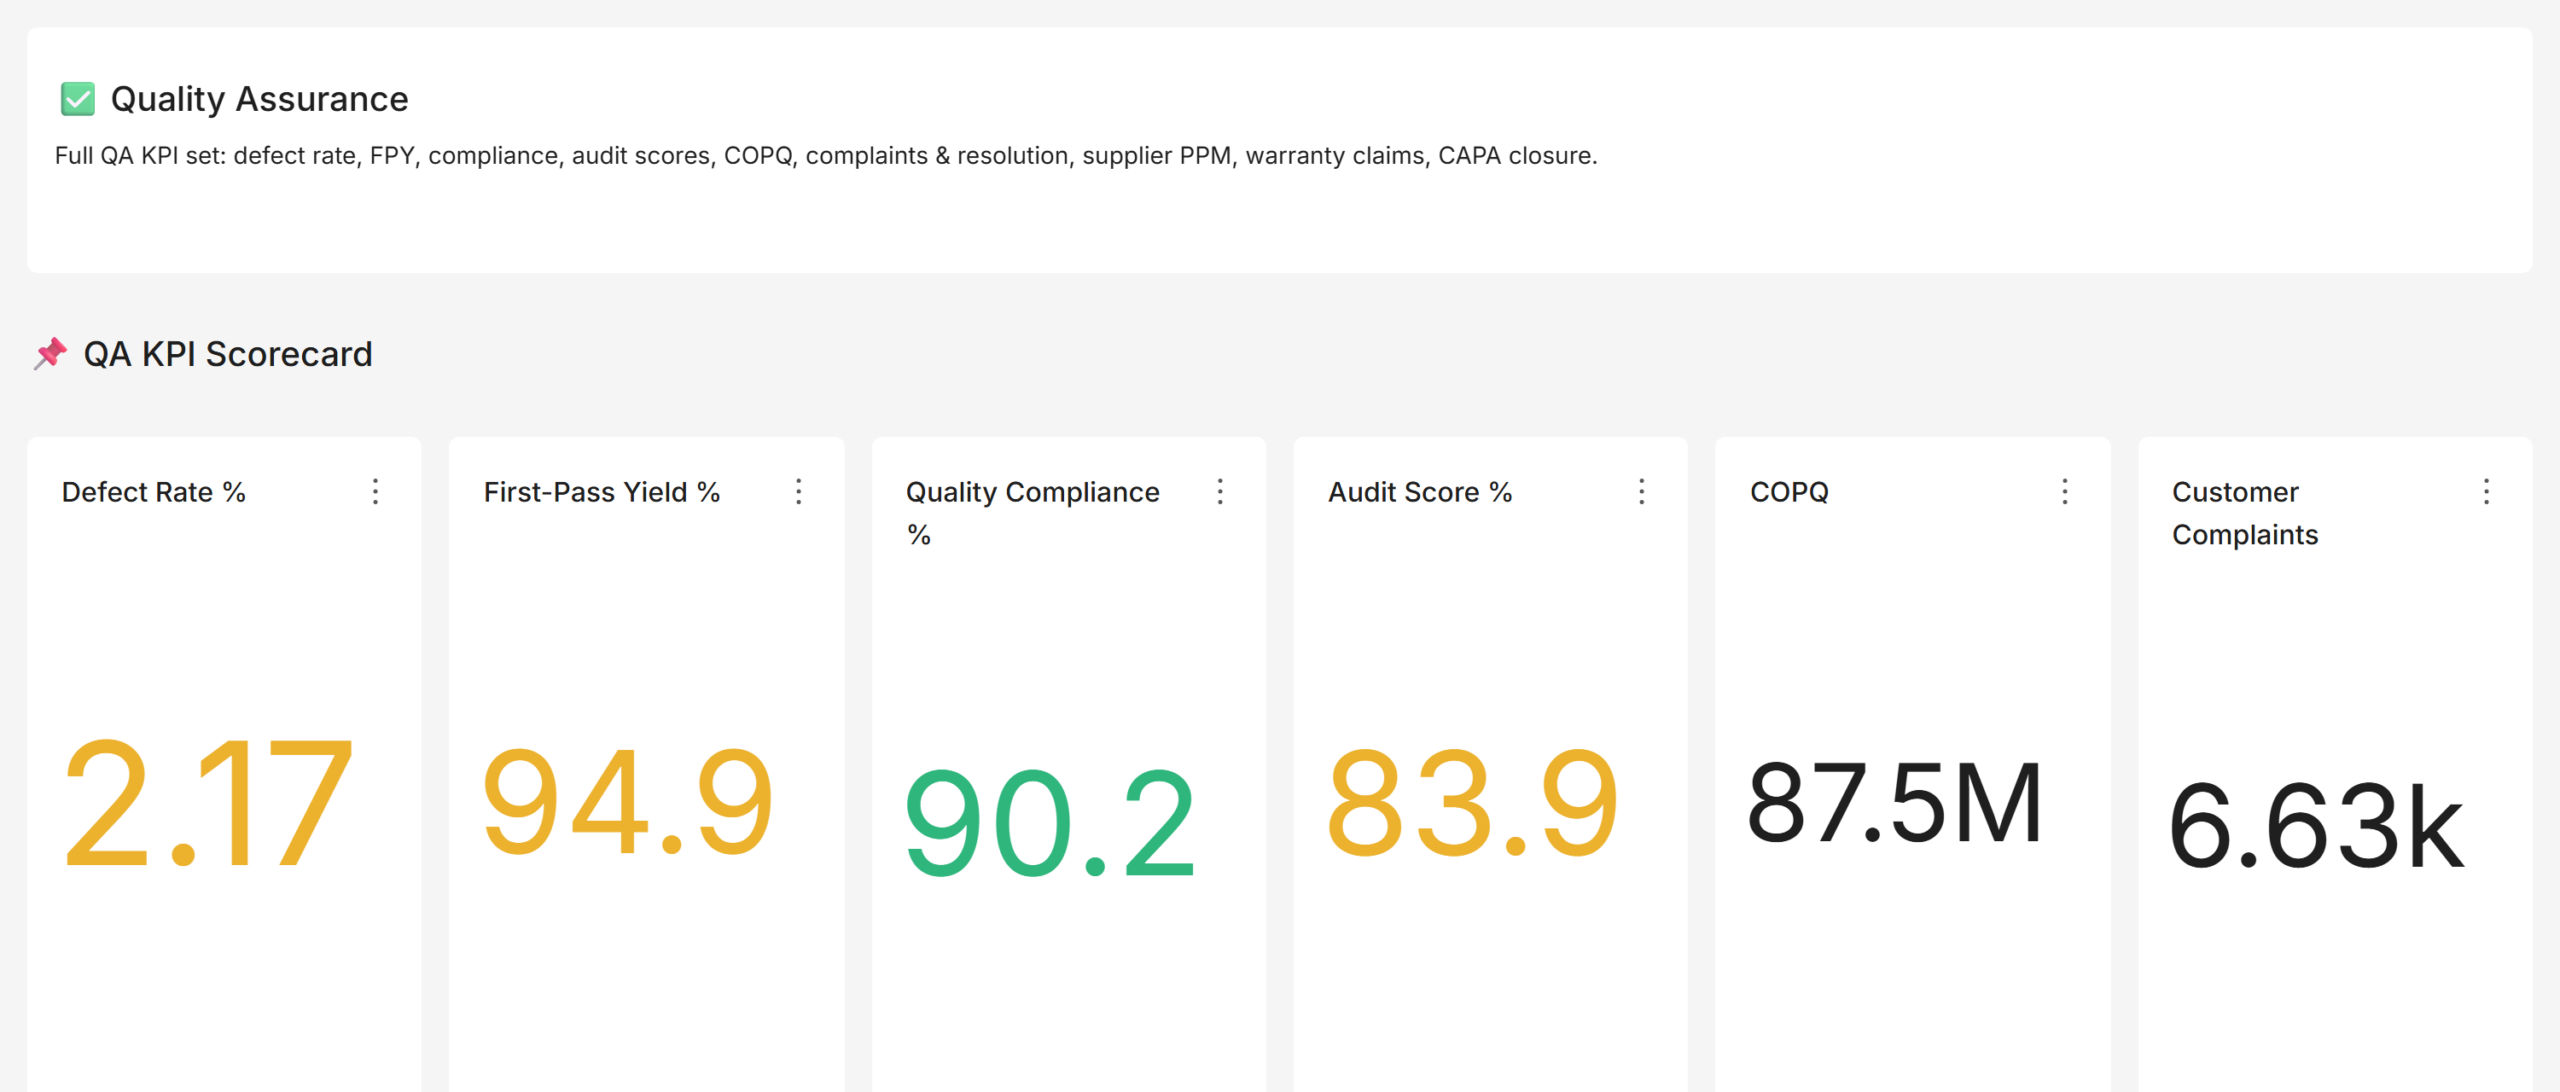
The quality template tracks defect rate, first-pass and rolled throughput yield, CAPA closure, audit scores, supplier defect PPM, and the cost of poor quality. The procurement template covers savings, vendor on-time and quality performance, emergency purchase share, spend under contract, and material availability. The maintenance template extends MTBF and MTTR with preventive-maintenance compliance, backlog, breakdown events, and the planned-versus-reactive ratio, the leading indicators that predict next quarter’s downtime.
Beyond Operations: Sales, Finance, and the Board-Level Domains
Manufacturing BI programmes often stop at the plant gate, which is a mistake: the same disciplines apply to the commercial and corporate functions, and the board reads them all on one page.
The sales templates layer the commercial view the way mature sales organisations do: an executive revenue view, a manager view with leaderboards and pipeline funnels, a rep view for personal performance, and dedicated dashboards for forecast and pipeline (weighted pipeline, coverage against quota, commit and best-case categories), win/loss and velocity (stage conversion, loss reasons, sales cycle), and customer and account health (net revenue retention, churn, backlog and book-to-bill, the KPI pair every industrial board asks about).
The finance templates go beyond the profit-and-loss basics into the balance-sheet strength a multinational needs: a cash flow and leverage view (operating, investing and financing cash flow, free cash flow, quick ratio, debt-to-equity, interest coverage) and a risk and working capital view (receivables aging, currency exposure and hedging, inventory days of supply, supplier concentration). The safety and sustainability templates complete the board pack with LTIFR and TRIFR, the incident pyramid, Scope 1 to 3 emissions, energy and water intensity, and certification coverage, the domains that regulators and lenders now expect as first-class reporting.
The Executive Layer
The executive templates roll one headline KPI per function onto a single page with RAG status, then provide consolidated, country-comparison, and business-unit-comparison views built on the same definitions. Because every template shares conformed dimensions, the group view and the plant view cannot disagree, and a board question about any tile drills straight into the owning department’s template without changing tools or definitions. 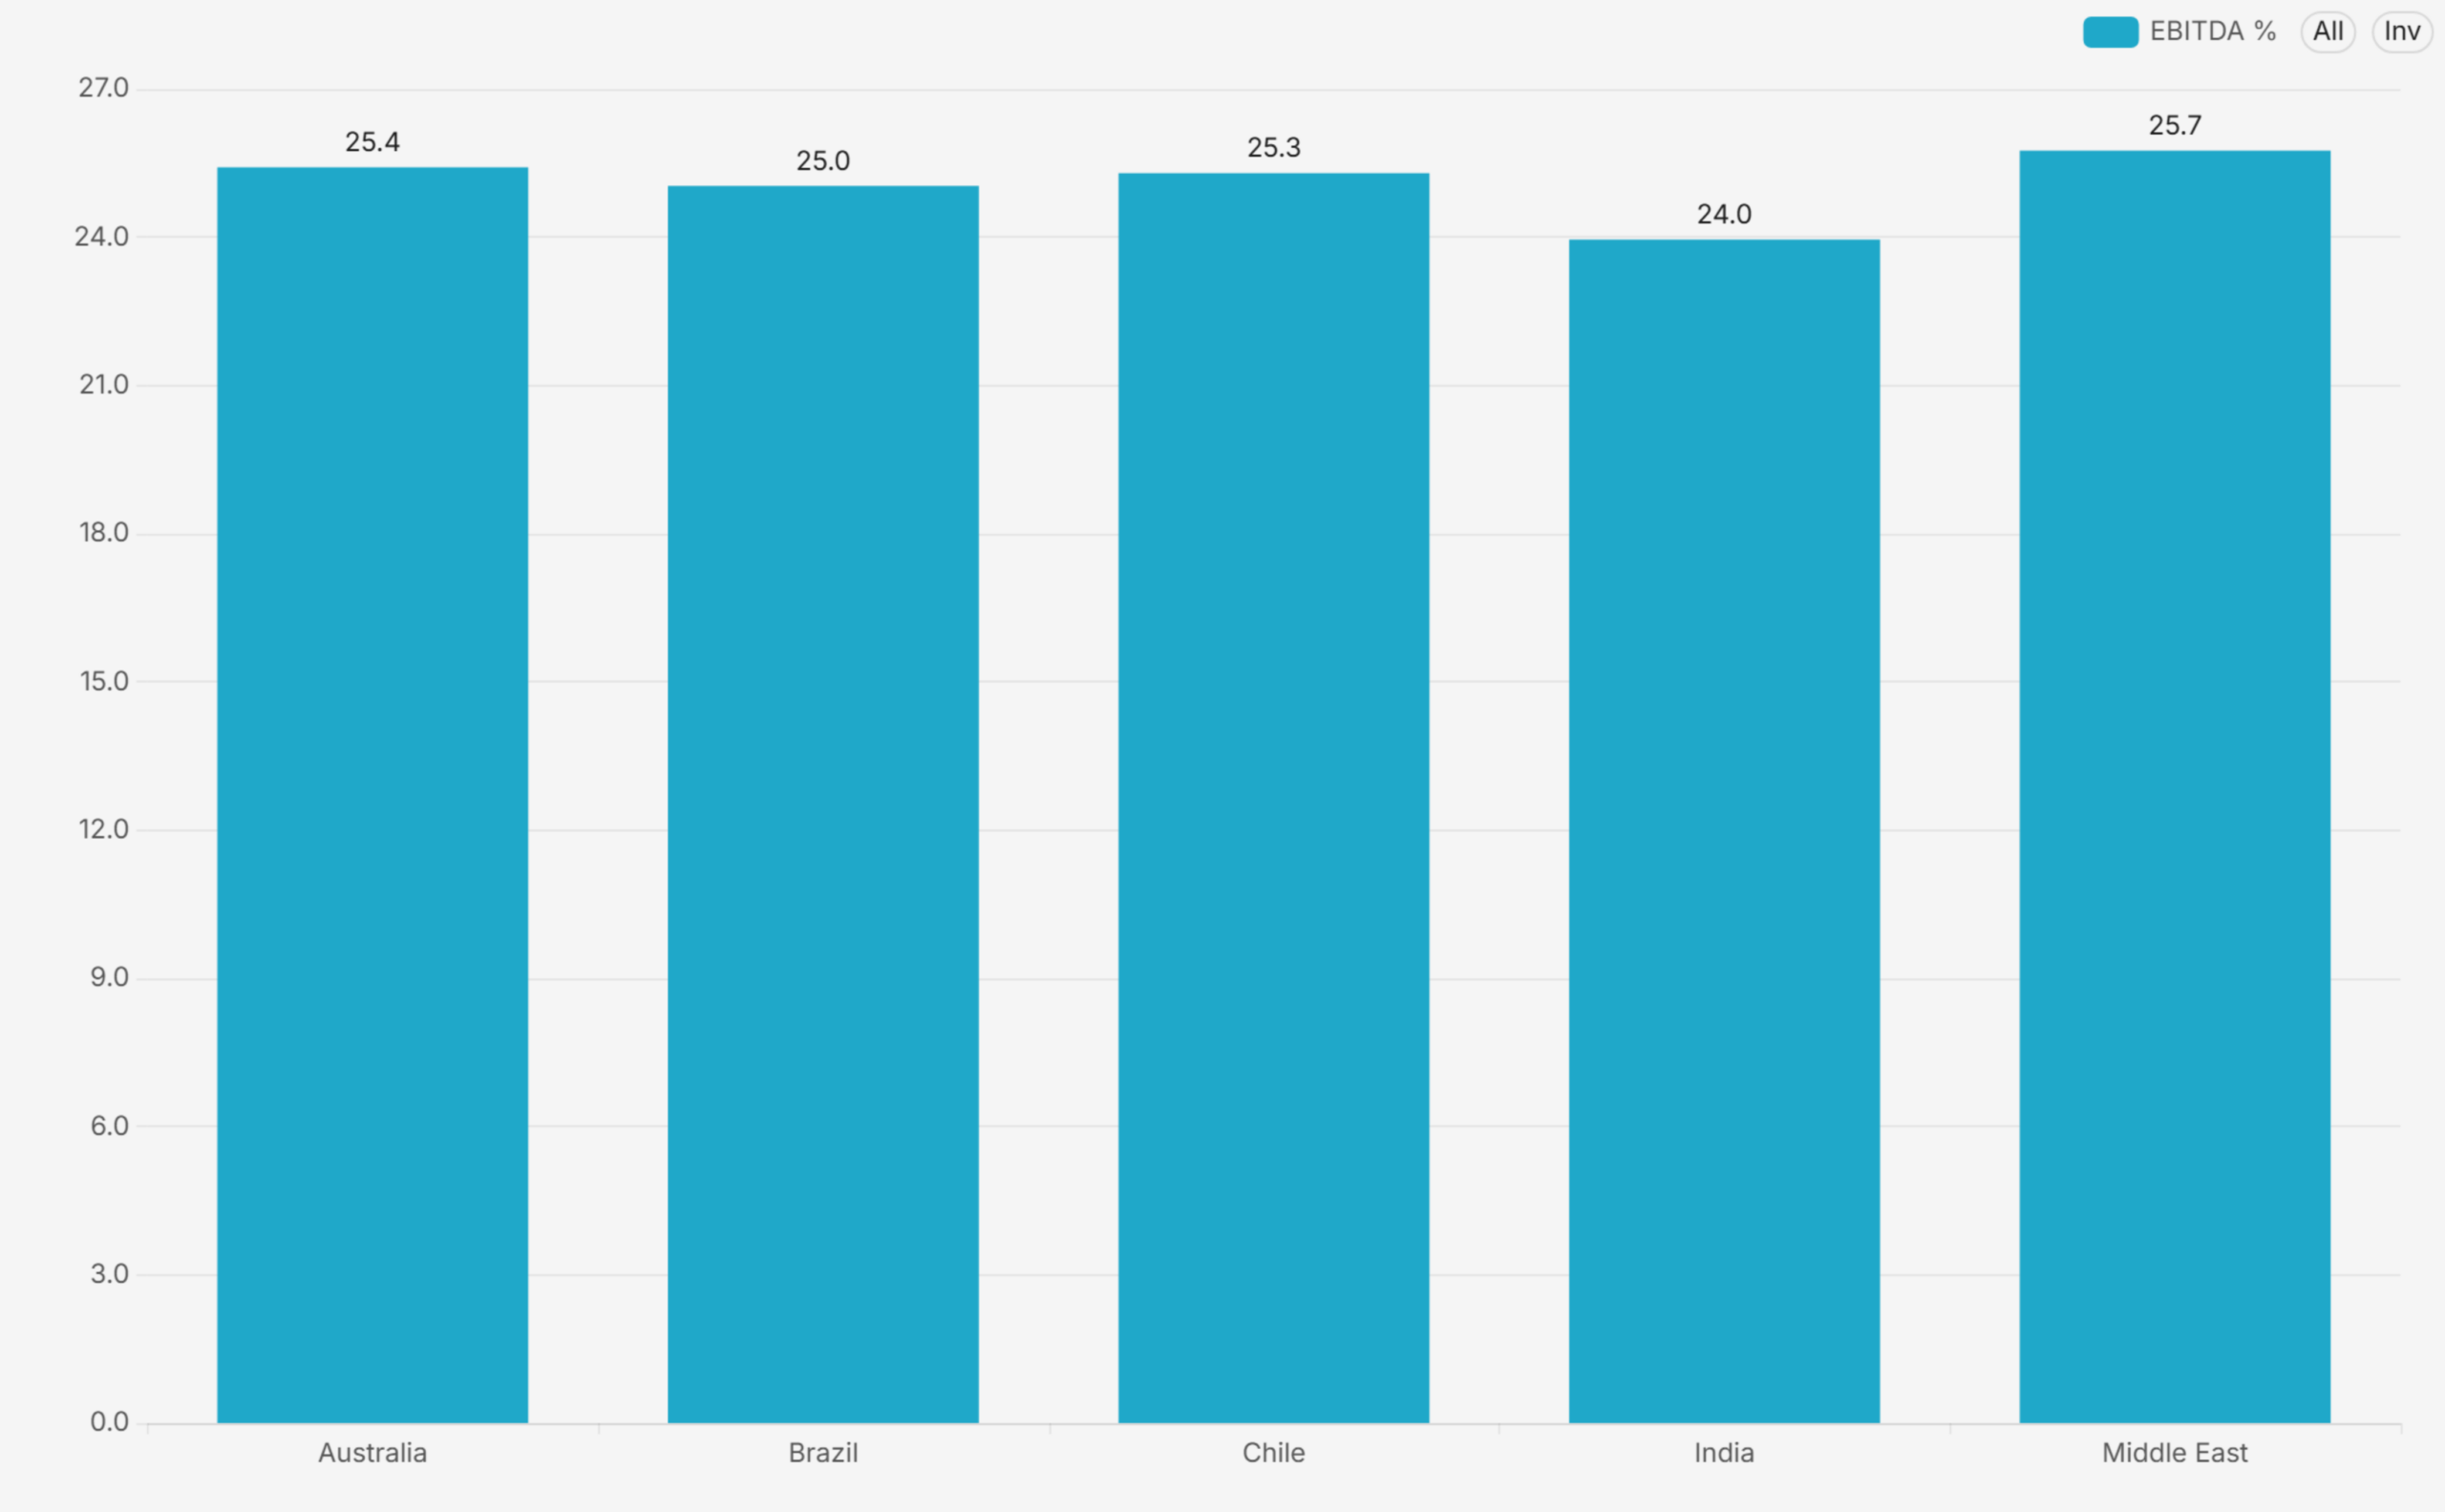
Common Mistakes When Adopting Templates
- Skipping the definition review: copying a template without confirming the KPI formula with the owning function. The template is a starting position, not a decree; a fifteen-minute review per KPI buys lasting trust in the numbers.
- Ignoring data grain: loading data at the wrong grain. If the template expects monthly plant-line data and the source provides only monthly plant totals, drill-downs silently mislead. Match the grain before go-live.
- Not pruning: keeping every template even where a function does not exist. An empty dashboard erodes confidence in the full suite; prune what does not apply.
- Frozen thresholds: treating RAG defaults as final. Industry defaults make the suite readable on day one, but each business sets its own ambition; recalibrate thresholds at the first quarterly review.
How to Customise the Templates to Your Business
- Point at your data: connect the certified datasets to your ERP, MES, QMS, CMMS, and HR sources. The templates are source-agnostic; only the dataset layer changes.
- Confirm definitions: review each KPI formula with the owning function and set your targets and RAG thresholds. This usually takes one workshop per department.
- Secure: apply row-level security so each country and business unit sees its own slice, and connect Single Sign-On to your identity provider.
- Brand and prune: apply your logo and colour theme, organise the folders to match your operating model, and retire any template that does not apply.
A template-based rollout typically reaches a governed, adopted suite in six to eight weeks, roughly half the timeline of a from-scratch build, with materially lower definition risk.
Frequently Asked Questions
Are dashboard templates really faster than building from scratch?
Yes, primarily because the slow part of BI is not chart-building but definition-settling. Templates arrive with standards-based KPI definitions that functions can review and adjust, which converts months of debate into days of confirmation.
Can the templates work with our ERP and MES?
Yes. The templates sit on a dataset layer that is mapped to your sources during onboarding. Any system that can land data in a SQL database, which includes every mainstream ERP, MES, QMS, and CMMS, can feed them.
Do the templates include targets and RAG thresholds?
They ship with industry-default thresholds for every KPI, which are then tuned to your targets during the definition workshops. The RAG logic is direction-aware, so lower-is-better metrics colour correctly.
Build It With Andolasoft
Andolasoft designs and deploys governed, board-ready analytics platforms on Apache Superset for manufacturing and industrial companies. Our BI practice covers the full lifecycle: KPI modelling to global standards (ISO 22400, SCOR, GRI), data modelling with conformed dimensions, department and business-unit dashboards with direction-aware RAG scorecards, row-level security, Single Sign-On, folder navigation and in-dashboard collaboration. Because Superset is open source, the entire platform runs without per-seat licence fees, so the investment goes into your KPIs, not licences.
If your leadership team is still waiting for month-end spreadsheets, talk to us. We will stand up a working demo on a representative dataset, walk your stakeholders through it, and give you a clear, fixed-scope plan to production.