In a crowded SaaS market, integrating analytics into your product is no longer optional—it is essential. That’s where embedded BI platforms come in.
This guide explores the best embedded BI platforms for SaaS companies, how to evaluate them, and how to implement them successfully.
You will walk away with clear insights so your SaaS product becomes more data-driven, sticky, and profitable.
What Are Embedded BI Platforms?
Put simply, BI platforms allow software vendors to integrate business intelligence directly into their applications.
Instead of users leaving the product to analyze data, they get actionable dashboards, visualizations, and analytics without context switching.
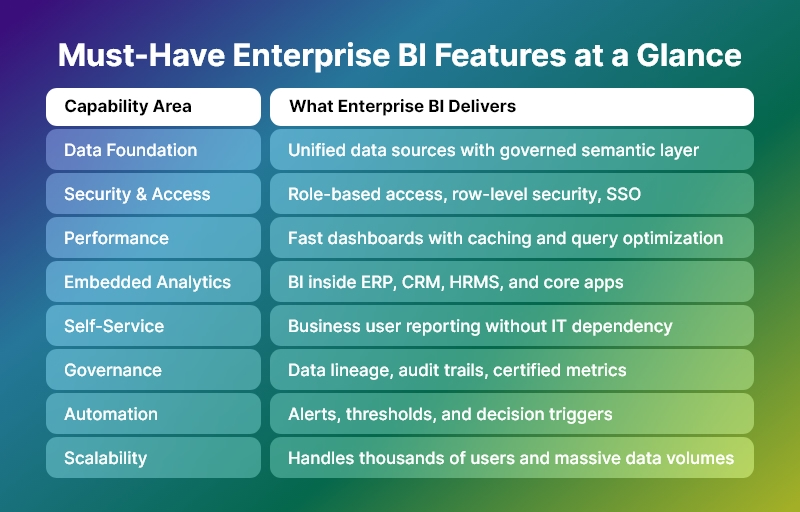
These platforms deliver:
- Real-time analytics inside your app
- Customizable dashboards
- Self-service reporting
- Advanced data modeling
- Alerts and notifications
- Role-based access
Embedding analytics transforms standard SaaS features into data-rich experiences. That makes your product more valuable to users and increases retention.

Why SaaS Companies Need Embedded BI Platforms
Before we review the best embedded BI platforms, let’s cover why they matter for SaaS companies:
- Retention and Stickiness: When users rely on analytics inside your app, they stay longer.
- Upsell Opportunities: Premium analytics features can drive higher-tier subscriptions.
- Better Decision-Making: Users make faster, smarter decisions with insights at their fingertips.
- Competitive Differentiation: Products with integrated analytics outperform competitors.
- Reduced Churn: Analytics help users see value faster, lowering churn.
Embedding analytics isn’t just a feature — it is a strategic advantage.
Criteria to Evaluate Embedded BI Platforms
Before choosing among BI platforms, assess them on:
- Integration complexity
- Scalability
- Custom branding
- API and SDK support
- Security and compliance
- Performance
- Pricing model
Use the following evaluation checklist:
Checklist for Choosing Embedded BI Platforms
- Offers white-labeling
- Supports multi-tenant SaaS
- Provides REST APIs
- Handles high query loads
- Role-based security
- GDPR and SOC 2 compliance
This checklist ensures you choose the right BI platforms for your growth goals.
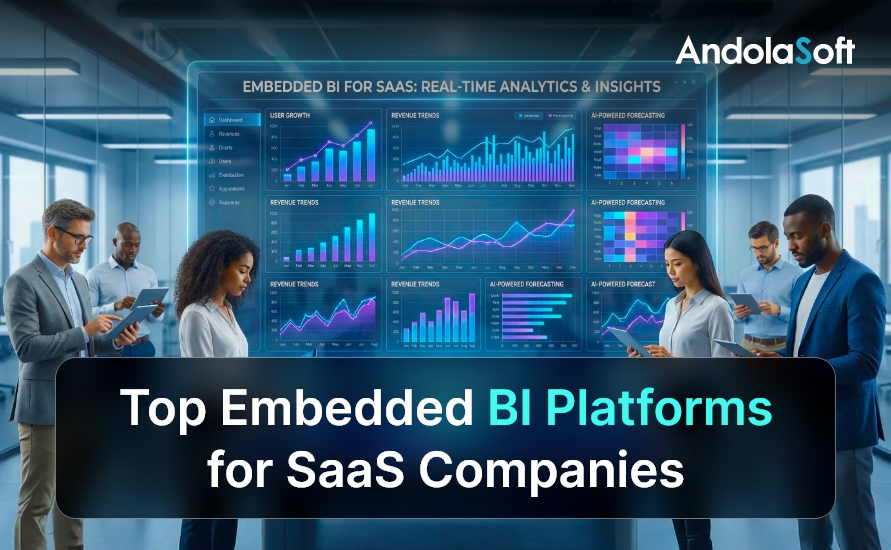
Top Embedded BI Platforms for SaaS Companies
Here are the best BI platforms that SaaS companies should consider. Each one is evaluated for scalability, ease of integration, and value for SaaS products.
1. Tableau Embedded Analytics
Tableau is a leader among embedded BI platforms with enterprise-grade analytics and robust visualization tools.
Pros:
- Advanced visuals
- Strong community and support
- Scales for enterprise users
Cons:
- Higher cost
- Requires more development effort
Best for: Large SaaS companies with complex analytics needs.
2. Power BI Embedded
Microsoft’s Power BI Embedded makes Tableau-level analytics accessible at a lower entry cost.
Benefits:
- Microsoft ecosystem integration
- Real-time dashboards
- Affordable pricing tiers
Considerations:
- Less flexible than some specialized products
- Licensing can be complex
Ideal for: SaaS companies using Azure and Microsoft tools.
3. Looker Embedded Analytics
Looker’s architecture makes it one of the most modern BI platforms available.
Highlights:
- Centralized data modeling
- SQL-based transformations
- Strong API support
Challenges:
- Learning curve for LookML
- Pricing tailored to enterprise customers
Perfect for: Data-centric SaaS applications and analytics-minded teams.
4. Sisense for Cloud Data Teams
Sisense offers powerful embedded analytics with flexible APIs and cloud-native performance.
Key Features:
- Elastic analytics engine
- Fully customizable UI
- Multi-tenant SaaS support
Points to Note:
- Teams need technical resources
- Pricing can scale with usage
Best fit: SaaS products requiring deep integration and customization.
5. Chartio (Now Part of Atlassian)
Although Chartio was acquired, its embedded analytics capabilities continue to influence current embedded BI platforms.
Pros:
- Simple interface
- Drag-and-drop analytics
- Fast onboarding
Limitations:
- Feature set not as deep as others
- Transitioning under new brand
Great for: Early-stage SaaS products with basic analytics needs.
6. Metabase Embedded
Metabase is an open-source option among embedded BI platforms, ideal for budget-conscious teams.
Advantages:
- Open-source flexibility
- Quick deployment
- Community support
Drawbacks:
- Limited enterprise features
- Requires self-management
Best choice: Small to mid-size SaaS companies.
7. Qlik Sense Embedded
Qlik Sense combines strong analytics with associative data indexing — great for complex data needs.
Benefits:
- Smart visual associations
- High performance
- Strong security
Considerations:
- Higher learning curve
- Pricing suited for large organizations
Best for: Data-intensive SaaS platforms.
Embedded Analytics Use Cases by Industry
Understanding real use cases clarifies how embedded BI platforms deliver value in specific scenarios.
SaaS Analytics Use Cases
- Customer Success Dashboards
- Product Usage Insights
- Financial Performance Metrics
- Operational Reports
- Executive Scorecards
Bullet points make complex benefits tangible:
- Track customer adoption trends
- Surface churn risk indicators
- Deliver revenue forecasting
- Enable self-service analytics
These use cases ensure embedded analytics adds measurable business outcomes.
Implementation Best Practices
Implementing BI platforms without a clear plan often leads to delays. Follow these steps for success:
Step-by-Step Strategy
Define Business Goals
- What decisions will analytics drive?
- Who are the users?
Prepare Your Data Infrastructure
- Centralize data
- Ensure quality and consistency
Select Your Embedded BI Platform
- Use the evaluation checklist above
- Build proof of concept
Design Dashboards for Users
- Keep it simple
- Prioritize actionable insights
Measure Adoption
- Track usage metrics
- Iterate on feedback
Implementing embedded analytics is a project — not just a purchase.
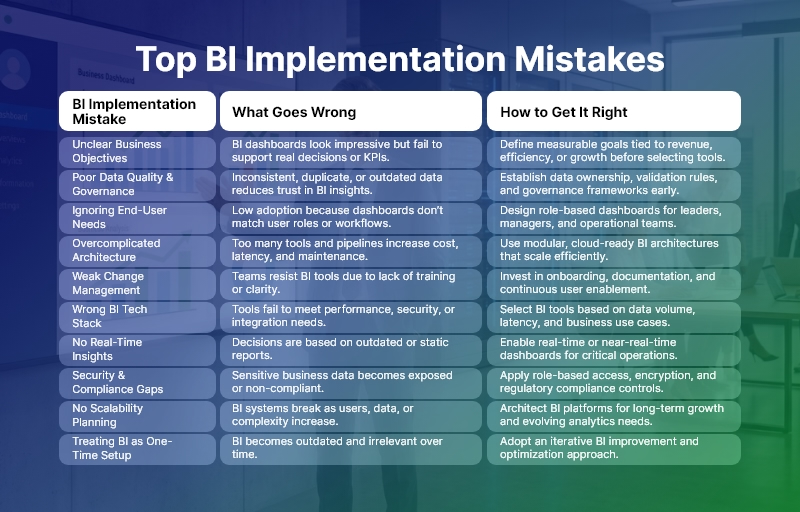
Common Mistakes When Choosing BI Platforms
Avoid these pitfalls:
- Choosing based on cost alone
- Ignoring future scalability
- Skipping user experience design
- Underestimating data governance needs
By avoiding these mistakes, SaaS companies maximize ROI from embedded analytics.
Pricing Models for Embedded BI Platforms
Understanding pricing helps SaaS teams budget appropriately.
Common Models:
- Per-user pricing
- Usage-based pricing
- API call pricing
Example bullet list:
- Flat licensing fee
- Tiered feature pricing
- Consumption-based billing
Always request transparent pricing before committing.
How to Measure Success
Quantifiable success metrics help justify investment in BI platforms:
- Time to insight
- Feature adoption rate
- Customer retention
- Upsell revenue
- Dashboard engagement
Measure these regularly to optimize value.
Integrating Embedded BI Platforms with SaaS Products
Integration approaches vary by platform:
Native SDK Integration
- Deep customization
- White-label analytics
iFrame Embedding
- Fast to deploy
- Limited customization
API-Driven Integration
- API first
- High control
Choose based on technical resources and product roadmap.
Conclusion
Choosing the right BI platforms can transform your SaaS product from a tool into a strategic asset. Embedded analytics drives retention, boosts revenue, and makes your product indispensable.
Evaluate these platforms based on your current needs and future goals, and implement them with a clear roadmap.
If you want growth, better user engagement, and data-driven value, embedded analytics is not optional — it is foundational.
FAQs
1. What are embedded BI platforms?
BI platforms are analytics solutions that allow SaaS companies to integrate dashboards, reports, and visual analytics directly into their applications, enabling users to access insights without leaving the product.
2. How do embedded BI platforms differ from traditional BI tools?
Traditional BI tools operate as standalone systems, whereas embedded BI platforms are integrated within SaaS products, offering contextual, in-app analytics tailored to end users.
3. Why are embedded BI platforms important for SaaS companies?
BI platforms improve product stickiness, reduce churn, enable data-driven decision-making, and create opportunities to monetize analytics as premium features.
4. Can small or early-stage SaaS companies use embedded BI platforms?
Yes. Many BI platforms offer flexible pricing, open-source options, or scalable architectures that suit startups and growing SaaS businesses.
5. What features should SaaS companies look for in embedded BI platforms?
Key features include multi-tenant support, white-labeling, API and SDK access, role-based security, scalability, performance optimization, and compliance capabilities.
6. Are embedded BI platforms secure for customer data?
Most enterprise-grade BI platforms provide strong security features such as role-based access control, encryption, audit logs, and compliance with standards like GDPR and SOC 2.
7. How long does it take to implement embedded BI platforms?
Implementation timelines vary based on complexity, data readiness, and customization needs, ranging from a few weeks to several months.
8. Can embedded BI platforms support multi-tenant SaaS architectures?
Yes. Leading BI platforms are designed to support multi-tenant environments, ensuring data isolation and secure analytics for each customer.
9. How do SaaS companies monetize embedded analytics?
SaaS companies monetize BI platforms through premium analytics tiers, add-on reporting modules, usage-based pricing, or enterprise analytics packages.
10. What are common mistakes when choosing embedded BI platforms?
Common mistakes include focusing only on cost, ignoring scalability, underestimating integration effort, neglecting user experience, and overlooking long-term data governance needs.