How BI for Retail Helps Brands Optimize Inventory & Sales?

Retailers today face unpredictable consumer demand, rising costs, and fierce competition across every channel. Traditional reporting methods can’t keep up with rapid shifts in buying behavior and supply chain disruptions. This is where BI for Retail becomes a strategic game changer. It empowers retail leaders with real-time visibility into sales, stock, customers, and profitability — enabling faster and smarter decisions that drive performance.

This guide explains how BI for Retail transforms data into insights that help brands optimize inventory and maximize sales growth.

Top Benefits of BI for Retail

What is BI for Retail?

BI for Retail refers to the use of business intelligence tools, analytics, and data visualization designed specifically for retail operations. It consolidates data from:

→ Giving retailers a single source of truth for accurate, fast decision-making.

Why Retailers Need BI Today

Retail Challenge BI for Retail Solution
Overstocking or stockouts Smart demand forecasting & replenishment optimization
High inventory carrying costs Better space utilization & inventory turnover
Limited insights into product performance Real-time SKU profitability
Ineffective promotions Campaign analytics & customer response insights
Slow reporting & decision delays Instant dashboards & automated KPIs
Omnichannel visibility issues Unified analytics across online & offline

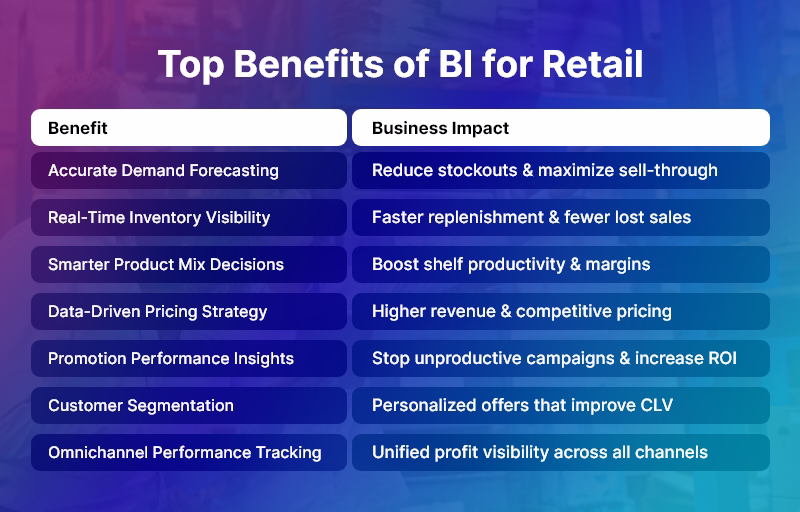
How BI Optimizes Inventory

BI ensures the right products are available at the right place and time — without excess waste.

Accurate Demand Forecasting

Predict future sales using:

  • Historical demand
  • Regional trends
  • External factors (weather, holidays)

➡ Lower stock imbalance & higher sell-through rates.

Real-Time Inventory Tracking

Centralized dashboards show exact inventory status across:

  • Stores
  • Warehouses
  • Online channels

➡ Faster replenishment & reduced lost sales.

Safety Stock Optimization

Analytics determine optimal stock buffers to avoid:

  • Stockouts
  • Rush orders
  • Customer dissatisfaction

Supplier Performance Insights

Measure vendor lead time, quality, and delivery reliability.

➡ Fewer delays + stronger procurement strategy.

Shrinkage & Waste Reduction

Retail BI detects:

  • Theft & pilferage patterns
  • Food/perishable spoilage
  • Storage inefficiencies

➡ Better bottom-line performance.

How BI Improves Sales Performance

Smarter Product Mix & Assortment Planning

Analyze:

  • Fast/slow movers
  • Store-level preferences
  • Cross-selling patterns

➡ Improve shelf productivity & margins.

Data-Driven Pricing Optimization

Use real-time pricing intelligence:

  • Margin impact
  • Competitor pricing
  • Customer elasticity

➡ Higher revenue with competitive pricing.

Promotion Analytics

Identify which offers truly drive:

  • Sales uplift
  • Repeat purchase
  • Basket value

➡ Stop spending on unproductive campaigns.

Customer Segmentation & Personalization

BI for Retail leverages RFM scoring to:

  • Reward loyal customers
  • Target offers precisely
  • Increase Customer Lifetime Value (CLV)

Omnichannel Performance Tracking

Bring together:

➡ Holistic insight into profitability across channels.

Key Retail KPIs Tracked Through BI

Inventory Metrics

  • Sell-through rate
  • Inventory turnover ratio
  • Days of inventory on hand
  • Stockout percentage

Sales Metrics

  • Gross margin return on investment (GMROI)
  • Basket size & conversion rate
  • Promo-driven sale percentage
  • Customer retention rate

➡ Retailers can monitor performance in real time.

Systems Integrated with BI

System Example Tools
POS Shopify POS, Square, Lightspeed
ERP SAP, Oracle, Tally
CRM Salesforce, HubSpot, Zoho
eCommerce Platforms Shopify, Magento, WooCommerce
Supply Chain Mgmt WMS, delivery analytics

Integration removes data silos for a unified retail intelligence ecosystem.

AI & Predictive Analytics in BI for Retail

Retail BI uses artificial intelligence to:

  • Predict future demand accurately
  • Suggest automated stock replenishment
  • Forecast the impact of promotions
  • Optimize pricing based on trends
  • Reduce overstock of declining products

➡ Better decisions with less manual effort.

BI for Multi-Location Retail

Benefit Business Impact
Store performance benchmarking Invest where growth is highest
Regional demand analysis Improve stock availability per location
Centralized analytics Consistent business reporting
Data-driven store expansion decisions Maximize ROI

Scalable intelligence for growth-oriented retail networks.

Short Case Example

A lifestyle retailer used BI for stock optimization:

Before BI After BI
22% lost sales due to stockouts <7% lost sales
Overpricing slow-moving stock Dynamic pricing increased sales
Manual, delayed reporting Real-time dashboards

Result: 12% revenue growth & increased customer satisfaction

Best Practices for BI for Retail Implementation

Best Practice Why It Matters
Prioritize clean and standardized data Accurate insights need reliable data
Define KPIs clearly Focus effort on business outcomes
Train teams for daily use Improve adoption across stores
Start with quick wins Build confidence in BI value
Scale to advanced analytics Predictive insights deliver higher ROI

Conclusion

Retail success now depends on data-driven agility — not guesswork.

BI for Retail helps brands:

  • Optimize inventory levels
  • Maximize sales and profitability
  • Improve customer satisfaction
  • Deliver an efficient omnichannel experience
  • Make informed, fast decisions at every level

Retailers that leverage BI for Retail build strong competitive advantages and unlock sustainable growth.

FAQs

How does BI for Retail help reduce stockouts?

It predicts demand and monitors inventory instantly, ensuring timely replenishment.

Can small retail businesses use BI?

Yes — cloud BI offers affordable, easy-to-adopt analytics.

How does BI improve retail profitability?

By optimizing pricing, reducing waste, and maximizing product performance.

What kind of data feeds BI?

POS, ERP, CRM, supply chain, and eCommerce data.

Does BI support omnichannel retail?

Absolutely — it unifies insights across online and in-store experiences.

Top 10 BI Implementation Mistakes and How to Get It Right?

Business Intelligence initiatives promise data-driven decision-making, operational clarity, and competitive advantage — yet, industry studies consistently show that a significant percentage of BI projects fail to deliver expected ROI. The reason is rarely the technology itself. More often, it is BI implementation mistakes made early in planning, execution, and adoption.

In today’s data-saturated landscape, organizations generate massive volumes of structured and unstructured data across applications, platforms, and devices. However, without a well-defined BI strategy, this data becomes fragmented, unreliable, and underutilized. As a result, leaders make decisions based on incomplete insights, outdated reports, or manual spreadsheets.

This blog breaks down the top 10 BI implementation mistakes organizations make — and more importantly, how to avoid them. You will learn best practices, frameworks, and actionable strategies to build BI systems that scale, perform, and drive measurable outcomes.

Drawing from real-world delivery experience, Andolasoft helps businesses design, build, and modernize BI platforms that convert raw data into actionable intelligence — securely and sustainably.

Top BI Implementation Mistakes

Business Need & Importance of Avoiding BI Implementation Mistakes

Modern businesses operate in environments where speed, accuracy, and insight define success. From healthcare providers optimizing patient outcomes to eCommerce brands improving conversions, BI has become a strategic necessity rather than a reporting add-on.

However, many organizations still struggle because of BI implementation mistakes, such as disconnected data sources, poorly defined metrics, and lack of stakeholder alignment. These issues lead to dashboards that look impressive but fail to answer real business questions.

Why BI matters today:

  • Healthcare: Enables predictive analytics, operational efficiency, and compliance reporting — without compromising data security.
  • eCommerce & SaaS: Drives personalization, churn reduction, and revenue forecasting through real-time insights.
  • Logistics & Manufacturing: Improves demand forecasting, inventory optimization, and cost control.
  • Fintech & Education: Ensures transparency, risk management, and performance tracking across complex systems.

Risks of poor BI implementation:

  • Inefficient decision-making due to inconsistent or inaccurate data
  • Security vulnerabilities caused by unmanaged data access
  • Low user adoption when BI tools are complex or irrelevant
  • Revenue loss from delayed insights and reactive strategies

Therefore, companies must move beyond patchwork tools and legacy reporting. They need modern, scalable BI solutions designed with clear business alignment — something Andolasoft specializes in through its BI, data analytics, and digital transformation services.

Top 10 BI Implementation Mistakes

1. Lack of Clear Business Objectives

Many BI projects start with tools instead of outcomes. Without defined goals, dashboards become cluttered and unused.

Best practice: Align BI initiatives with KPIs such as revenue growth, operational efficiency, or customer retention.

2. Poor Data Quality and Governance

Inconsistent, duplicate, or outdated data undermines trust in BI systems.

Best practice: Implement strong data governance, validation rules, and ownership models early.

3. Ignoring End-User Needs

BI built only for leadership often fails adoption at operational levels.

Best practice: Design role-based dashboards tailored for executives, managers, and frontline teams.

4. Overcomplicated Architecture

Excessive tools, pipelines, and integrations increase maintenance costs.

Best practice: Use modular, cloud-ready architectures with scalable data pipelines.

5. Underestimating Change Management

Users resist BI if it disrupts workflows without training.

Best practice: Invest in onboarding, documentation, and continuous enablement.

6. Choosing the Wrong Tech Stack

Not all BI tools fit all use cases.

Best practice: Select tools based on data volume, latency, security, and integration needs.

7. No Real-Time or Near-Real-Time Capabilities

Static reports limit agility.

Best practice: Enable real-time dashboards for critical business functions.

8. Weak Security & Compliance Planning

BI systems often expose sensitive data.

Best practice: Apply role-based access control, encryption, and compliance frameworks.

9. Failing to Plan for Scale

What works for 10 users fails at 1,000.

Best practice: Architect BI for future growth in users, data sources, and analytics complexity.

10. Treating BI as a One-Time Project

BI requires continuous evolution.

Best practice: Adopt an iterative improvement model with regular feedback loops.

Customer Success

For example, a mid-sized eCommerce SaaS company partnered with Andolasoft to overcome recurring BI implementation mistakes that limited visibility into customer behavior and revenue trends.

The company struggled with siloed data across CRM, marketing automation, and finance tools. Reports were manually generated, often inconsistent, and delayed by weeks.

Andolasoft designed a unified BI architecture that integrated all data sources into a centralized analytics platform. Role-based dashboards were created for leadership, marketing, and operations teams. Automated pipelines ensured real-time data availability with built-in governance and security controls.

Results within 4 months:

  • 35% faster decision-making cycles
  • 28% improvement in campaign ROI
  • 50% reduction in manual reporting effort
  • Single source of truth across departments

The transformation allowed leadership to shift from reactive decisions to proactive, insight-led strategies — demonstrating the value of avoiding common BI implementation mistakes with the right technology partner.

Key Takeaways & Closing

Successful BI initiatives are not about dashboards — they are about decisions, outcomes, and impact. Most failures stem from avoidable BI implementation mistakes, including unclear goals, poor data quality, and lack of user adoption.

The most important takeaways:

  • Start with business objectives, not tools
  • Invest in data governance and security
  • Design BI for users, scale, and continuous improvement
  • Choose experienced partners who understand both technology and business

As data complexity grows, organizations that modernize BI thoughtfully will gain a decisive advantage. With deep expertise in BI, AI, data analytics, SaaS engineering, and digital transformation, Andolasoft helps businesses build future-ready BI platforms that deliver lasting value.

Avoid the pitfalls. Build BI the right way — starting now.

FAQs

1. What are the most common BI implementation mistakes?

The most common BI implementation mistakes include unclear objectives, poor data quality, low user adoption, and lack of scalability planning.

2. Why do BI projects fail despite good tools?

BI fails due to strategy, governance, and adoption issues — not because of tools. Avoiding BI implementation mistakes requires business alignment.

3. How long does a successful BI implementation take?

A well-planned BI implementation typically takes 3–6 months, depending on data complexity and integration scope.

4. How can companies improve BI adoption?

User-centric design, role-based dashboards, and training significantly improve BI adoption.

5. Is cloud BI better for modern businesses?

Yes. Cloud BI offers scalability, cost efficiency, and faster deployment when implemented correctly.

6. How does Andolasoft support BI initiatives?

Andolasoft provides end-to-end BI services, including strategy, architecture, development, analytics, and ongoing optimization.

7. Can BI be integrated with AI and machine learning?

Absolutely. Modern BI platforms integrate AI and ML for predictive insights, anomaly detection, and automation.

Top 10 Differences Between BI & Data Analytics

In today’s data-driven economy, organizations generate more data than ever before. According to industry research, enterprises analyze less than 30% of the data they collect, leaving valuable insights untapped. This challenge has made analytics-driven decision-making a boardroom priority.

However, one critical confusion persists across leadership teams: BI vs Data Analytics. While these terms are often used interchangeably, they serve distinct business purposes, operate at different levels of maturity, and answer fundamentally different questions.

Understanding the difference between BI vs Data Analytics is no longer optional. For CTOs, founders, and product leaders, this clarity directly impacts investment decisions, platform selection, team structure, and long-term scalability.

In this blog, you’ll learn the top 10 differences between BI vs Data Analytics, real-world use cases across industries, best practices for implementation, and how organizations can combine both for maximum impact. You’ll also see how Andolasoft, with deep expertise in BI, AI, machine learning, and data analytics, helps businesses design future-ready data ecosystems that drive measurable outcomes.

Top 10 Differences Between BI and Data Analytics

Business Need & Importance of Understanding BI vs Data Analytics

Modern organizations operate in an environment defined by speed, competition, and constant change. As a result, leadership teams need accurate insights, predictive intelligence, and real-time visibility to stay ahead. This is where understanding BI vs Data Analytics becomes critical.

Why This Distinction Matters Today

Business Intelligence focuses on what has already happened, while Data Analytics goes further to explain why it happened and what is likely to happen next. Companies that fail to distinguish between the two often invest in tools that don’t align with their goals, resulting in low adoption and poor ROI.

Industry-Wide Challenges

  • Healthcare organizations struggle with historical reporting but need predictive analytics for patient outcomes and capacity planning.
  • eCommerce companies rely on BI dashboards for sales tracking but require advanced analytics for personalization and demand forecasting.
  • Logistics and supply chain firms need BI for operational visibility, yet analytics for route optimization and risk prediction.
  • Fintech and SaaS companies depend on BI for compliance reporting while using analytics for fraud detection and churn reduction.
  • Manufacturing enterprises use BI for production reporting and analytics for predictive maintenance.

Risks of Not Modernizing

Organizations that rely only on legacy BI or fragmented analytics face serious risks:

  • Delayed decision-making due to static reports
  • Revenue loss from missed predictive opportunities
  • Operational inefficiencies and higher costs
  • Poor customer experiences due to lack of personalization
  • Inability to scale analytics across teams

Therefore, businesses need strategic, integrated data platforms instead of patchwork tools. This is where a trusted technology partner like Andolasoft plays a vital role in aligning BI vs Data Analytics with business objectives.

Top 10 Differences Between BI vs Data Analytics

1. Purpose and Core Objective

  • Business Intelligence (BI) primarily focuses on monitoring past and present performance through dashboards, KPIs, and standardized reports.
  • Data Analytics, on the other hand, aims to discover patterns, uncover root causes, and predict future outcomes using advanced analytical techniques.

2. Type of Questions Answered

  • BI answers “What happened?” and “What is happening now?”, enabling descriptive insights.
  • Data Analytics answers “Why did it happen?” and “What will happen next?”, enabling diagnostic and predictive insights.

3. Data Complexity and Depth

  • BI works best with structured, clean, and historical data from data warehouses.
  • Data Analytics handles large, complex, and unstructured datasets, including logs, text, IoT data, and behavioral data.

4. Tools and Technologies Used

  • BI relies on tools like Power BI, Tableau, Looker, and Superset for visualization and reporting.
  • Data Analytics uses Python, R, SQL, Spark, ML frameworks, and AI models for deep analysis.

5. User Base and Skill Requirements

  • BI is designed for business users, executives, and operational teams with minimal technical skills.
  • Data Analytics is driven by data analysts, data scientists, and engineers with strong statistical and programming expertise.

6. Time Orientation

  • BI is historical and real-time, focusing on trends and current performance.
  • Data Analytics is forward-looking, emphasizing forecasting, simulation, and optimization.

7. Level of Automation

  • BI dashboards require manual interpretation and predefined metrics.
  • Data Analytics enables automated insights, anomaly detection, and recommendations through AI and ML.

8. Business Impact Scope

  • BI supports operational efficiency and management reporting.
  • Data Analytics drives strategic transformation, innovation, and competitive advantage.

9. Scalability and Flexibility

  • BI solutions are often rigid, built around fixed KPIs.
  • Data Analytics platforms are highly scalable and flexible, evolving with business needs.

10. Decision-Making Power

  • BI enables reactive decision-making based on known metrics.
  • Data Analytics empowers proactive and predictive decision-making with higher accuracy.

Best Practices, Frameworks & Actionable Tips for BI vs Data Analytics

Step-by-Step Recommendations

  • Define business objectives first, then decide whether BI, Data Analytics, or both are required.
  • Establish a single source of truth using centralized data warehouses or data lakes.
  • Adopt modular architectures that allow BI and analytics to coexist seamlessly.

Best Practices

  • Standardize KPIs for BI to ensure consistency across teams and departments.
  • Invest in data quality and governance, as analytics accuracy depends on clean data.
  • Enable self-service BI while maintaining controlled access to advanced analytics.

Frameworks & Architectures

  • Modern Data Stack (ETL/ELT, cloud data warehouse, BI layer, analytics layer).
  • Lakehouse Architecture for combining BI reporting and advanced analytics.
  • MLOps frameworks to operationalize analytics models at scale.

Do’s and Don’ts

  • Do align BI dashboards with business outcomes, not vanity metrics.
  • Do not overcomplicate BI with unnecessary analytics models.
  • Avoid siloed tools that prevent data sharing across teams.

Quick Wins

  • Automate recurring BI reports to save time.
  • Introduce predictive analytics for high-impact use cases like churn or demand forecasting.

How Andolasoft Helps

Andolasoft enables organizations to implement BI vs Data Analytics effectively through:

  • Custom Web & Mobile Development for analytics-driven applications
  • SaaS Product Engineering with embedded BI and analytics
  • BI, AI & Machine Learning Solutions for predictive intelligence
  • Data Analytics & Application Modernization for legacy systems
  • DevOps, Cloud & Automation for scalable performance

Choosing Andolasoft ensures faster implementation, lower risk, and measurable business value.

Customer Success

For example, a mid-sized healthcare SaaS provider, partnered with Andolasoft to modernize its reporting and analytics platform. Initially, the company relied solely on BI dashboards to track patient engagement and operational metrics.

Andolasoft implemented a unified BI vs Data Analytics solution, combining real-time dashboards with predictive analytics models. Within four months, achieved:

  • 35% faster reporting cycles
  • 25% reduction in operational inefficiencies
  • Improved patient outcome predictions by 40%
  • Higher adoption of analytics across leadership teams

By integrating BI for visibility and Data Analytics for prediction, transformed decision-making from reactive to proactive.

Key Takeaways & Closing

Understanding the difference between BI vs Data Analytics is essential for modern businesses.

  • BI delivers clarity on past and present performance.
  • Data Analytics unlocks predictive and prescriptive intelligence.
  • Together, they create a powerful foundation for data-driven growth.

Organizations that adopt both strategically gain better visibility, smarter decisions, and sustainable competitive advantage. With the right partner, businesses can avoid common pitfalls and maximize ROI.

Andolasoft brings proven expertise in BI vs Data Analytics, helping organizations design, build, and scale intelligent data solutions that drive real outcomes.

FAQs

1. What is the main difference between BI vs Data Analytics?

BI focuses on historical reporting and dashboards, while Data Analytics emphasizes predictive and diagnostic insights using advanced techniques.

2. Can BI and Data Analytics work together?

Yes. Combining BI vs Data Analytics enables organizations to track performance and predict future outcomes effectively.

3. Which is better for executives: BI or Data Analytics?

Executives typically rely on BI for quick insights, while analytics supports strategic forecasting and long-term planning.

4. Is Data Analytics more expensive than BI?

Data Analytics often requires more skilled resources, but it delivers higher strategic value when implemented correctly.

5. Do small businesses need BI vs Data Analytics?

Yes. Even small businesses benefit from BI dashboards and targeted analytics for growth and efficiency.

6. How does Andolasoft help with BI vs Data Analytics?

Andolasoft designs end-to-end BI and analytics solutions, from data engineering to AI-driven insights.

7. When should a company move beyond BI to Data Analytics?

When businesses need forecasting, automation, and deeper insights beyond descriptive reporting, Data Analytics becomes essential.

Top 15 Benefits of Implementing a Self-Service BI Platform

Today, leaders across industries face a common challenge: business decisions must be faster, more data-driven, and more accurate than ever before. Yet most organizations still struggle with slow reporting cycles, fragmented data sources, and overloaded IT teams. This is where a Self-Service BI Platform creates real competitive advantage.

By empowering teams to independently access, analyze, and visualize data, businesses unlock agility, reduce bottlenecks, and drive high-velocity execution. Moreover, organizations embracing self-service analytics report 30–50% faster decision-making, according to several global BI studies.

In this blog, you’ll discover the top 15 benefits of implementing a Self-Service BI Platform, why it matters in today’s digital era, and how companies can adopt it effectively. You’ll also see how Andolasoft, with its proven expertise in BI, AI, machine learning, SaaS engineering, data analytics, and enterprise solutions, helps global brands transform their data capabilities.

Top 15 Benefits of a Self-Service BI Platform

Why Modern Businesses Need a Self-Service BI Platform

In most organizations, analytics has long been an IT-driven process. Departments rely on data teams to prepare reports, extract datasets, or build dashboards. This creates delays, limits innovation, and slows decision-making.

A Self-Service BI Platform resolves these gaps by democratizing access to insights. It enables business users — sales managers, finance teams, marketers, operations leaders, and product managers — to explore data on their own without technical dependencies.

Why It Matters Today

Modern industries — from healthcare and manufacturing to fintech and eCommerce — operate in fast-moving environments. Data volumes continue to explode, yet delayed insights cause missed opportunities. A Self-Service BI Platform resolves these challenges by:

  • Reducing the decision-making cycle from days to minutes by enabling users to generate reports on demand.
  • Aligning teams on real-time data rather than outdated spreadsheets or manual data pulls.
  • Cutting operational inefficiencies caused by poor data visibility or inconsistent reporting practices.

Industry Use Cases

A Self-Service BI Platform delivers measurable impact across sectors:

  • Healthcare: clinicians access real-time patient metrics, improving care delivery and operational planning.
  • Ecommerce: marketing and product teams monitor campaign performance, purchase behavior, and funnel drop-offs instantly.
  • Manufacturing: plant managers analyze downtime, production defects, and supply chain trends without waiting for IT support.
  • Fintech: regulatory, fraud, and transaction dashboards become self-operational, reducing compliance risks.
  • SaaS: product teams iterate faster using usage analytics, churn insights, and cohort reports.

Risks of Not Adopting Self-Service Analytics

Organizations that do not modernize continue to struggle with:

  • Long reporting delays that slow strategic decisions.
  • High dependency on IT, delaying innovation.
  • Data silos leading to inconsistent insights across teams.
  • Security vulnerabilities due to manual exports and spreadsheet sharing.
  • Revenue loss from inaccurate forecasting or delayed insights.

In a digital-first world, a Self-Service BI Platform is not a luxury—it is a foundational operational capability that enables enterprises to scale efficiently and securely.

Top 15 Benefits of Implementing a Self-Service BI Platform

Below are the most impactful advantages organizations gain when adopting a modern, enterprise-grade Self-Service BI Platform.

1. Faster Decision-Making Across Departments

A Self-Service BI Platform eliminates dependencies on IT teams, enabling business users to generate insights instantly. This results in significantly shorter decision cycles, faster approvals, and quicker execution across sales, finance, supply chain, and operations.

2. Reduced IT Workload & Operational Bottlenecks

IT teams often spend 40–60% of their workload on routine reporting tasks. By shifting routine analytics to end-users, a Self-Service BI Platform frees technical teams to focus on strategic initiatives like automation, modernization, or AI implementation.

3. Unified Data Visibility Across the Organization

Self-service BI brings every department onto a centralized data platform, ensuring everyone works with the same numbers. This promotes alignment, reduces conflicts, and eliminates discrepancies in decision-making.

4. Improved Data Accuracy & Governance

With automated pipelines, role-based access, and standardized dashboards, organizations greatly reduce errors caused by spreadsheets, manual consolidation, and outdated reports.

5. Empowered Business Users and Greater Ownership

Teams that can explore their own data develop deeper analytical thinking and take more ownership of KPIs. This creates a performance-driven culture where insights drive action.

6. Real-Time Reporting and Live Dashboards

Traditional BI usually relies on static reports. A Self-Service BI Platform enables dynamic dashboards that refresh automatically, ensuring real-time visibility into KPIs, customer behavior, and operational metrics.

7. Enhanced Collaboration Between Technical and Business Teams

With self-service analytics, business teams independently generate insights while IT teams focus on data quality, security, and architecture. This leads to stronger collaboration and better alignment.

8. Lower Operational Costs

By automating reporting workflows and reducing manual effort, organizations often reduce analytics costs by 25–40%. The Self-Service BI Platform becomes an engine for efficiency and resource optimization.

9. Discovery of New Insights & Opportunities

Self-service exploration encourages curiosity and experimentation. Teams uncover patterns, root causes, and opportunities that would otherwise remain hidden in data silos.

10. Scalability for Growing Teams & Data Volumes

Self-service BI tools are built for scale. As new departments, markets, or product lines are added, the platform can easily expand without architectural bottlenecks.

11. Stronger Data Security Through Centralized Access Controls

A Self-Service BI Platform reduces risk by eliminating unsecured spreadsheets and enabling enterprise-grade permissions, encryption, and audit trails.

12. Automation of Repetitive Analytics Tasks

Scheduled reports, automated alerts, and prebuilt dashboards minimize manual effort. Teams always have updated insights without repetitive data pulls.

13. Better Customer Experience Through Faster Insights

Modern businesses rely heavily on customer analytics. Self-service BI enables rapid insight into churn, retention, behavior, and personalization opportunities.

14. Improved Forecasting and Strategic Planning

With real-time access to historical and current data, leadership teams produce more accurate forecasts, financial models, and growth strategies.

15. Higher Organizational Agility and Competitive Advantage

Ultimately, a Self-Service BI Platform enables companies to react faster, innovate more confidently, and stay ahead of competition by making decisions powered by real-time intelligence.

Best Practices for Implementing a Self-Service BI Platform

Success with self-service analytics requires thoughtful strategy, process alignment, and the right technology foundation. Below are actionable best practices and frameworks.

1. Establish Clear Data Ownership

Define who manages data quality, governance, and access. Clear roles prevent duplication, data drift, or inconsistent definitions.

2. Build a Centralized Data Architecture

Consolidate sources into a unified data warehouse or lakehouse. This ensures reliability, consistency, and scalability for high-volume analytics.

3. Choose a Flexible, Scalable BI Toolset

Evaluate tools based on visualization capabilities, governance, performance, security, and integration ease.

4. Implement Role-Based Access Controls

Ensure users only access relevant datasets. This protects sensitive information while enabling broad adoption.

5. Standardize Dashboards & Metrics

Create a universal KPI library so every team uses the same definitions for revenue, churn, conversion, utilization, and performance.

6. Enable Training & Upskilling for Non-Technical Teams

Provide training programs on data literacy, dashboard building, and analytics best practices.

7. Use Automation Wherever Possible

Automate ETL pipelines, alerts, data quality checks, and scheduled reporting.

8. Monitor Usage & Continuously Improve

Review dashboard adoption, usage statistics, load times, and user feedback to refine BI strategy.

How Andolasoft Helps Companies Build a Powerful Self-Service BI Platform

Andolasoft provides end-to-end BI and analytics expertise across:

We design scalable, secure, and intuitive BI environments that empower business users while maintaining enterprise governance.

Case Study

For example, a mid-sized transportation provider, partnered with Andolasoft to build a BI Platform that unified data from fleet systems, driver apps, billing tools, and telematics. Within 10 weeks, the company achieved:

  • 40% faster operational decisions due to real-time dashboards.
  • 30% reduction in manual reporting efforts, freeing teams for revenue-generating activities.
  • Enhanced route optimization, reducing fuel costs by nearly 18%.

Here’s what changed: managers gained instant access to KPIs, predictive insights improved planning, and operational bottlenecks reduced significantly.

Key Takeaways

A Self-Service BI Platform is no longer optional—it is essential for modern, data-driven enterprises. The most important insights include:

  • It accelerates decision-making and reduces IT dependency.
  • It creates real-time, unified visibility across the organization.
  • It boosts efficiency, accuracy, governance, and competitive advantage.
  • It empowers teams to innovate, experiment, and take ownership of outcomes.

Organizations implementing a Self-Service BI Platform today position themselves for long-term scalability, efficiency, and digital transformation.

FAQs

1. What is a Self-Service BI Platform?

It is a modern analytics system that enables non-technical users to access, explore, and visualize data independently, without relying on IT teams.

2. Why do businesses need a Self-Service BI Platform?

It improves decision-making speed, reduces bottlenecks, eliminates data silos, and empowers teams to work with accurate data in real time.

3. Is a the BI Platform secure?

Yes. These platforms use role-based permissions, audit trails, encryption, and centralized governance to ensure data protection.

4. How long does implementation typically take?

Depending on the complexity, implementation can take 4–12 weeks with proper planning, architecture setup, and user onboarding.

5. What industries benefit most from a BI Platform?

Healthcare, eCommerce, fintech, manufacturing, logistics, SaaS, retail, and education all gain substantial advantages from real-time analytics.

6. Does Andolasoft build custom BI solutions?

Absolutely. Andolasoft specializes in end-to-end BI engineering, AI-driven analytics, ML models, SaaS development, and enterprise-grade data platforms.

7. Can a Self-Service BI Platform integrate with existing systems?

Yes, modern BI tools integrate seamlessly with CRMs, ERPs, SaaS apps, databases, cloud systems, and third-party APIs.

Cloud-Based BI: Why Companies Are Migrating in 2026?

In 2025, over 80% of enterprises are projected to rely on Cloud-Based BI for data-driven decision-making, according to a Gartner report.

Yet many organizations still struggle with legacy analytics tools that can’t handle fast-growing data volumes, distributed teams, and real-time insight demands.

This blog explores why Cloud-Based BI is essential for leaders seeking a competitive advantage — plus practical migration strategies and a real-world success example.

With Andolasoft as your trusted partner, you can modernize your analytics and unlock faster value.

Cloud BI vs On-Prem BI What Drives Migration in 2026

Why Cloud-Based BI Matters for Modern Businesses

As data complexity increases, traditional on-prem analytics become roadblocks. Cloud-Based BI helps organizations:

Key Benefits

  • Scalability on Demand: Instantly scale compute and storage — zero hardware upgrades required.
  • Enhanced Data Security: Cloud-native encryption, identity management, and compliance controls.
  • Cost Predictability: Move from CAPEX to OPEX with flexible pay-as-you-grow pricing.

Industries Transforming Through Cloud BI

  • Healthcare: Real-time patient analytics for better outcomes
  • eCommerce: Personalized offers based on live segmentation
  • Logistics: Smart routing with real-time shipment + traffic data
  • Fintech: Continuous fraud detection automation
  • Education: Adaptive learning and student success analytics

Risks of Staying On-Prem

  • Manual reporting → slower decisions
  • Vulnerable security posture
  • Delayed insights → lost revenue
  • Outdated dashboards → poor user experience

Modern BI demands unified data, automated pipelines, and scalable architectures — and the cloud delivers exactly that.

How to Successfully Migrate: Best Practices & Frameworks

Migration requires planning. Use this proven roadmap:

Define Clear Business Objectives

Align KPIs across teams (e.g., reduced churn, faster operations).

Choose the Right Cloud Deployment

Model Best For
Public Cloud Scalability + low maintenance
Private Cloud Highly sensitive data + compliance needs
Hybrid Cloud Balanced security, cost & control

Adopt Modern Architectures

  • Lambda Architecture → real-time + historical data
  • Data Mesh → decentralized data ownership

Build a Modern Data Stack

  • Ingestion: Fivetran, Talend
  • Warehousing: Redshift, BigQuery, Synapse
  • BI Tools: Tableau, Power BI, Looker

Prioritize Governance & Security

  • RBAC, data masking
  • Automated compliance monitoring (GDPR, HIPAA)

Optimize for Performance & Cost

  • Auto-scaling clusters
  • Query caching & materialized views

Enable DevOps + Automation

  • IaC (Terraform / CloudFormation)
  • CI/CD for BI pipelines

Quick Wins

  • Migrate high-impact dashboards first
  • Introduce self-service analytics
  • Automated anomaly detection for data quality

How Andolasoft Accelerates Cloud-Based BI Adoption

We specialize in:

  • Custom Web & Mobile BI Interfaces
  • SaaS Platform Engineering
  • AI/ML-driven predictive analytics
  • Application modernization & data migration
  • DevOps, Cloud & automation services

Our end-to-end support ensures a seamless journey from discovery → deployment → optimization.

Explore BI & Analytics Services (internal link)

Customer Success Story

A leading healthcare provider partnered with Andolasoft to modernize patient analytics.

Impact Achieved in 3 Months

  • 70% faster reporting
  • 40% reduction in readmissions with predictive risk scores
  • Automated ingestion from 10+ EMR systems

Outcomes

  • Clinicians gained anywhere-access to real-time dashboards
  • Leadership achieved full operational visibility
  • IT costs dropped 30% and shifted from maintenance to innovation

Key Takeaways

  • Cloud BI is essential for scalability, security & real-time insights
  • Modern data frameworks (Lambda, Data Mesh) ensure efficiency
  • Strong governance + automation = long-term success
  • Staying on-prem creates avoidable risk and revenue drag
  • Andolasoft delivers expertise to reduce cost, risk, and timelines

FAQs

What is Cloud-Based BI and why is it important?

A cloud-hosted analytics solution delivering real-time insights, scalability, and cost efficiency for modern data demands.

How do I start migrating?

Set measurable goals, select a cloud model, modernize your data stack, and begin with high-value use cases.

Which industries benefit most?

Healthcare, eCommerce, logistics, fintech, and education see significant ROI through automation and predictive analytics.

What security measures are essential?

RBAC, data encryption, compliance automation (GDPR/HIPAA), and regular audits.

Is Cloud BI affordable for small businesses?

Yes — pay-as-you-go pricing makes enterprise-grade analytics accessible.

How does Andolasoft support BI transformation?

We deliver development, data, AI/ML, and DevOps expertise for secure, scalable implementations.

What pitfalls should we avoid?

Big-bang migrations, poor governance, and lack of stakeholder alignment — use a phased, strategic approach.