Business intelligence succeeds or fails based on the quality, reliability, and speed of data flowing into analytics systems. However, as data sources multiply and format fragments, manual data preparation quickly becomes unmanageable. This is precisely where ETL tools become mission-critical.
ETL tools form the backbone of every modern BI pipeline. They extract raw data from multiple systems, transform it into analytics-ready formats, and load it into data warehouses or lakes. When implemented correctly, these tools eliminate data bottlenecks, improve trust in reports, and accelerate decision-making.
In this comprehensive guide, you will learn how ETL tools streamline BI pipelines, how they work, which architectures matter, and how to select and implement them for long-term analytics success.
What Are ETL Tools in Business Intelligence?
ETL stands for Extract, Transform, Load. They automate this process so analytics teams no longer depend on fragile scripts or manual workflows.
In a BI context, they act as the operational layer between data sources and analytics platforms. As a result, they ensure that dashboards, reports, and KPIs are built on consistent, governed data.
At a high level, ETL tools:
- Extract data from operational systems
- Transform raw data into clean, structured formats
- Load curated datasets into BI-ready storage
Because BI decisions depend on accuracy and timeliness, these tools directly influence business outcomes.
Why ETL Tools Are Critical for BI Pipelines
Without ETL tools, BI pipelines often collapse under scale, complexity, and inconsistency. Therefore, organizations rely on these tools to maintain stability as data volumes grow.
Key reasons these tools are essential include:
- They standardize data from multiple sources
- They automate repetitive data preparation tasks
- They enforce data quality and validation rules
- They reduce dependency on manual spreadsheets
- They enable scalable analytics architectures
Consequently, these tools transform BI from reactive reporting into proactive intelligence.
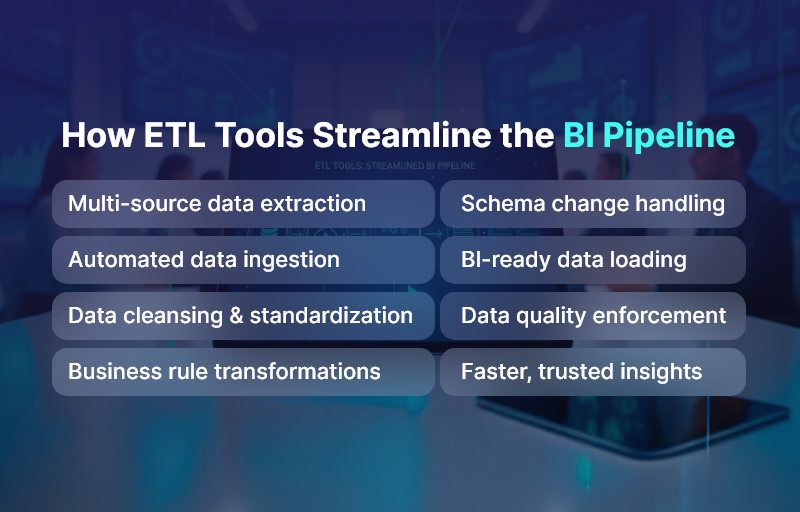
How ETL Tools Streamline the BI Pipeline
They streamline BI pipelines by introducing structure, automation, and governance at every stage of data movement.
1. Data Extraction at Scale
Modern tools connect to dozens or even hundreds of data sources. These sources include databases, SaaS platforms, APIs, flat files, and streaming systems.
These tools simplify extraction by:
- Supporting prebuilt connectors
- Handling schema changes automatically
- Scheduling incremental data pulls
- Managing API limits and retries
As a result, BI teams gain reliable access to all relevant data without custom engineering.
2. Data Transformation for Analytics Readiness
Raw data is rarely suitable for BI. Therefore, ETL tools apply transformations that align data with analytical requirements.
Common transformations include:
- Data cleansing and deduplication
- Data type normalization
- Business rule application
- Aggregations and calculations
- Dimensional modeling (facts and dimensions)
Because transformations are automated and repeatable, these tools ensure consistency across all BI reports.
3. Loading Data into BI Storage Layers
Once transformed, these tools load data into target systems optimized for analytics.
Typical BI destinations include:
- Cloud data warehouses
- On-premise data warehouses
- Data lakes or lakehouses
- OLAP cubes
By managing load strategies efficiently, they reduce latency and improve dashboard performance.
ETL vs ELT: Which Model Supports Modern BI?
While these tools remain foundational, many BI pipelines now adopt ELT architectures. Understanding the difference is essential.
ETL Model
- Data is transformed before loading
- Suitable for legacy systems
- Strong governance upfront
ELT Model
- Raw data loads first
- Transformations run inside the warehouse
- Ideal for cloud-scale BI
Many modern tools support both ETL and ELT patterns. Therefore, organizations can evolve their BI pipelines without replacing tooling.
Core Capabilities to Look for in ETL Tools
Not all tools deliver equal value. When evaluating tools for BI, prioritize capabilities that reduce operational risk and improve scalability.
Essential features include:
- Visual pipeline design
- Automated scheduling and orchestration
- Error handling and alerting
- Data lineage and metadata tracking
- Schema evolution support
- Security and access controls
Because BI pipelines run continuously, tools must operate reliably with minimal manual intervention.
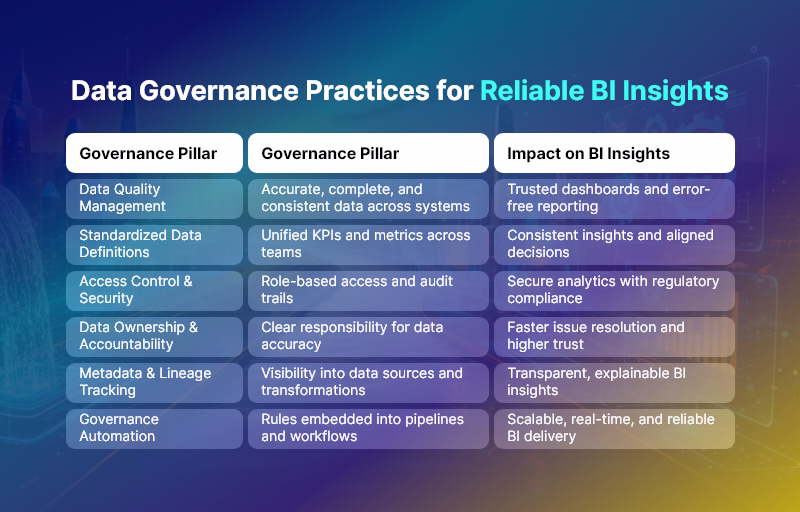
Tools and Data Quality Management
BI credibility depends on data quality. Therefore, these tools must enforce quality checks throughout the pipeline.
ETL tools improve data quality by:
- Validating fields and formats
- Enforcing referential integrity
- Flagging missing or anomalous values
- Logging transformation errors
As a result, stakeholders trust BI insights and act on them confidently.
ETL Tools and BI Governance
Beyond data movement, These tools play a central role in BI governance.
They support governance by:
- Documenting data transformations
- Tracking source-to-report lineage
- Enforcing role-based access
- Supporting audit and compliance requirements
Consequently, ETL tools bridge the gap between analytics agility and enterprise control.
Common BI Use Cases Powered by These Tools
ETL tools enable a wide range of BI scenarios across industries.
Typical use cases include:
- Executive dashboards
- Financial reporting and forecasting
- Sales and marketing analytics
- Customer behavior analysis
- Operational performance tracking
Because ETL tools unify disparate data sources, BI teams gain a single source of truth.
Best Practices for Implementing These Tools in BI Pipelines
To maximize ROI, organizations must implement ETL tools strategically.
Follow these best practices:
- Start with high-impact BI use cases
- Design modular, reusable pipelines
- Document transformation logic clearly
- Monitor pipeline performance continuously
- Optimize for scalability early
By following these practices, tools remain assets rather than technical debt.
Challenges When Using ETL Tools — and How to Overcome Them
Despite their value, tools introduce challenges if mismanaged.
Common challenges include:
- Pipeline sprawl
- Poor transformation design
- Insufficient monitoring
- Over-customization
However, disciplined governance, standardized patterns, and regular reviews mitigate these risks effectively.
The Future of ETL Tools in BI
ETL tools continue to evolve alongside BI platforms. Increasingly, they integrate automation, AI-driven optimization, and real-time processing.
Key trends include:
- Low-code and no-code tools
- Real-time and streaming ETL
- AI-assisted data mapping
- Unified ETL and data observability
Therefore, ETL tools will remain central to BI pipelines for years to come.
Final Thoughts: Why ETL Tools Define BI Success
These tools are not optional infrastructure. They are the operational foundation of every scalable BI strategy. By streamlining data ingestion, transformation, and delivery, tools ensure that insights arrive faster, cleaner, and more reliably.
When organizations invest in the right ETL tools and implement them with discipline, BI evolves from fragmented reporting into a strategic decision engine. Ultimately, these tools do not just move data — they unlock business intelligence at scale.
Frequently Asked Questions (FAQs)
What are ETL tools and why are they important for BI pipelines?
These tools automate the extraction, transformation, and loading of data into analytics systems. They are essential because they ensure data accuracy, consistency, and timely availability for BI reporting and decision-making.
How do ETL tools improve data quality in business intelligence?
These tools apply validation rules, cleansing logic, deduplication, and standardization during data processing. As a result, BI dashboards rely on trusted, analytics-ready data instead of raw or inconsistent inputs.
What is the difference between ETL and ELT tools in BI architecture?
These tools transform data before loading it into the warehouse, whereas ELT tools load raw data first and transform it inside the analytics platform. Modern tools often support both approaches to accommodate cloud BI environments.
Which data sources can ETL tools integrate with?
These tools integrate with databases, cloud applications, APIs, flat files, IoT streams, and legacy systems. This flexibility allows organizations to unify data from multiple operational platforms into a single BI pipeline.
How do ETL tools support scalable BI pipelines?
These tools scale by handling large data volumes, parallel processing, incremental loads, and automated scheduling. Therefore, BI pipelines continue to perform reliably as data and users grow.
Are ETL tools suitable for real-time or near-real-time BI?
Yes, many modern tools support real-time or near-real-time data ingestion using streaming or micro-batch processing. This enables BI teams to deliver up-to-date dashboards and operational insights.
How do tools help with BI governance and compliance?
These tools maintain data lineage, transformation documentation, access controls, and audit logs. Consequently, organizations meet governance, regulatory, and compliance requirements while preserving analytical agility.
What features should BI teams prioritize when selecting ETL tools?
BI teams should prioritize automation, monitoring, error handling, scalability, metadata management, and ease of integration. These features ensure tools remain reliable and manageable over time.
Can ETL tools reduce manual effort in BI reporting?
Absolutely. Tools eliminate manual data preparation, spreadsheet consolidation, and ad-hoc scripting. As a result, analysts focus more on insights and less on data wrangling.
How do tools contribute to faster decision-making?
By delivering clean, timely, and consistent data into BI systems, tools reduce reporting delays and data disputes. Therefore, decision-makers act faster and with greater confidence.