Building Secure Research Collaboration Portals: Key Decisions

TL;DR

A research collaboration portal needs five decisions made early: who the partners are, how they sign in, how documents move through review, how partner data stays separate, and who supports the portal after launch. Make each decision in writing, then build to it. Test access before launch.

A portal gives collaborators one place for projects, documents and approvals. When it is built without clear rules, partners see too much, approvals stall, and nobody knows which version is final. Decide the rules first, then design the screens.

Decision 1: Define partners and roles

List every type of user. Typical roles are principal investigator, coordinator, partner, external reviewer and auditor. For each role, write what the user may see, change and approve. A role without a written rule will drift over time.

Decision 2: Choose how partners sign in

Partners often belong to different institutions, each with its own identity system. Decide whether to use single sign-on, email sign-in or both. Require multi-factor sign-in for every account that can see sensitive data. Agree the rules for external reviewers with your IT team.

Decision 3: Control how documents move through review

Document review needs clear states, such as draft, in review, approved and final. Each change should record who made it and when. Approvals should name the approver. A portal that shows “approved” without a name gives no assurance.

Here is a small example. A protocol passes through 3 review steps: coordinator, principal investigator and ethics reviewer. Each step has one named approver. The protocol is final only after all 3 approvals. If one approver is missing, the status stays “in review,” and the system sends a reminder.

Decision 4: Keep partner data separate

Each partner should see only the projects and documents its role allows. Test this with real accounts before launch. Check the boundary from each role, including the edge cases, such as a partner who joins a project late.

Decision 5: Agree support after launch

A portal changes after launch. Users ask for new fields, partners join and leave, and security updates arrive. Agree a support plan with response times, a change process and a monthly review.

Common mistakes

Teams often add partners before defining roles. Another common mistake is treating the portal as finished at launch. Plan the first review for one month after go-live.

Design the approval workflow

An approval workflow shows who must act next and what happens after each decision. Draw it on one page before you build it. Mark which steps are optional, which can run in parallel and which must finish in order. Give each step a deadline or a reminder, so a missing approval does not stall the study.

Decide what happens when someone is unavailable. Name a delegate for each approver, and record delegation in the system. Without a rule for absence, approvals stop whenever a person travels or takes leave.

Plan partner onboarding

Partners join at different times and with different levels of technical skill. Write a short onboarding guide with the first three tasks each role performs: signing in, finding the project and submitting a document. Test the guide with one partner before you invite the rest.

Keep onboarding records. Note who was invited, which role they hold and when they joined. When a partner leaves, the record makes removal of access straightforward.

Protect documents after they are approved

Approval does not end the need for control. Approved documents should be read-only for most users, and each change should create a new version. Keep the previous versions available for audit. Decide how long documents are kept and how they are removed at the end of a project, and write that rule into the portal’s policy.

Test with real users before launch

Run a pilot with one real project and a small group of partners. Ask them to complete their normal tasks in the portal, and watch where they stop. Most usability problems show up in the first week of a pilot, and they are cheaper to fix then than after launch. Keep a list of every issue, its owner and its status until the pilot closes.

FAQ

Can external partners sign in without an institutional account?

Yes, if your policy allows it. Use controls that your IT team approves, and limit what external accounts can see.

How do we keep partner data separate?

Set access by project and role, and test each boundary before launch. Review access whenever a partner joins or leaves.

What should a portal log?

Log sign-ins, document changes, approvals and access changes. Keep the log long enough to meet your policy.

Next step

Read our research portal development page for how we scope a portal. To discuss your partners and roles, book a discovery call.
Cloud Infrastructure for University Research Centers: A Guide

TL;DR

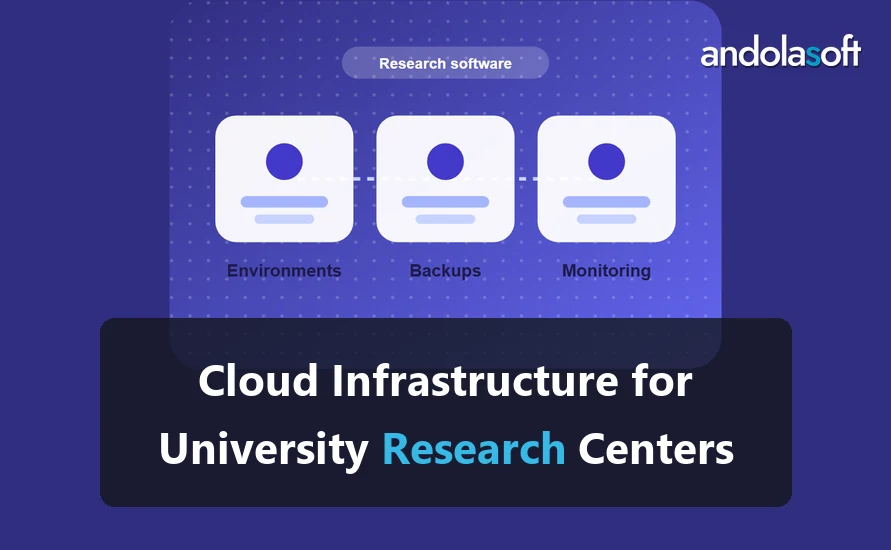
Plan research cloud infrastructure around four things: separate environments, role-based access, tested backups and monitoring. Decide early who runs the environment, your IT team or a partner. Choose the hosting that your data rules allow, including on-premise options where policy requires them.

Research centers run many projects, each with its own data and its own grant. Shared infrastructure with no clear rules leads to mixed data, unclear costs and unknown access. A planned environment prevents those problems and keeps each project separate.

Separate the environments

Use three environments for each application: development, testing and production. Developers work in development. Testers check releases in testing. Only approved releases reach production. Separation limits the damage from a mistake and makes changes easier to review.

Control access by role

Give each person the access their role needs. Principal investigators, coordinators, analysts and partners should not share one login. Use multi-factor sign-in for staff and partners, and review access on a set schedule. Record every change to access.

Test backups and restores

A backup you have never restored is a guess. Agree the backup schedule and retention with your IT team. Then restore a sample of data into a separate environment, check it, and record the result. Repeat the test on a fixed schedule.

Here is a worked example. A center runs 3 projects. Each project has 2 environments that hold data, so there are 6 data environments. A weekly backup for each gives 6 backups a week. If the team tests one restore per project each month, that is 3 restore tests a month. Each test checks one project’s data, so the three tests cover all 3 projects.

Monitor for failures and unusual access

Set alerts for downtime, low storage and unusual access. Send alerts to the people who can act on them. A monitoring setup that nobody reads does not protect anything.

Decide who runs it

Your IT team can run the environment, or a partner can run it for you. A third option is a partner who builds it, then hands over runbooks and trains your staff. Whichever you choose, write down who responds to alerts and who approves changes.

Plan capacity and cost together

Capacity and cost are linked. A research environment sized for peak use wastes money for most of the year. An environment sized for average use fails when a grant deadline or a large data load arrives. Plan for the usual load and a clear way to add capacity for known peaks, such as a data release or a conference deadline.

Tag each resource with its project and owner. Monthly cost reports by tag show which project uses what. Those reports make budget discussions concrete, and they show when a project has outgrown its environment.

Give partners controlled access

Research projects often include partners outside the institution. Give partners access to the specific environment and data they need, through accounts that your IT team manages. Avoid shared logins and temporary access that never expires. Review partner access when a project ends, and remove it on the same day.

Keep the runbooks current

A runbook describes how to respond to a known problem. It names the alert, the first check, the person to call and the steps to restore service. Write runbooks for the failures you expect, and test them during a planned exercise. A runbook that has never been tested is a draft.

Review the setup every year

Research needs change faster than most IT plans. Each year, review the environments, the access list and the backup schedule with the research leads. Remove environments that no project uses, and check that each project’s data still sits where the data policy requires. Record the review, so the next team knows what was decided and why.

Prepare for an audit

Auditors and data governance teams ask the same questions each time. Where is the data stored? Who can access it? How do you know the backups work? Keep the answers in one short document, with links to the access list, the backup test records and the environment diagram. Preparing this once makes each audit faster.

FAQ

Should a research center use one cloud account or many?

Use separate accounts or projects for separate grants or data owners. That keeps access and costs easy to track.

Can research data stay on-premise?

Yes, where your policy requires it. The design follows the hosting you approve, and the same principles of separation, access and backup still apply.

How often should we test restores?

Test on a fixed schedule that your team agrees, and test again after any major change.

Next step

Read our research cloud solutions page to see how we scope this work. To plan the environment for your center, book a discovery call.

Custom Research Software vs Off-the-Shelf Tools: How to Choose

TL;DR

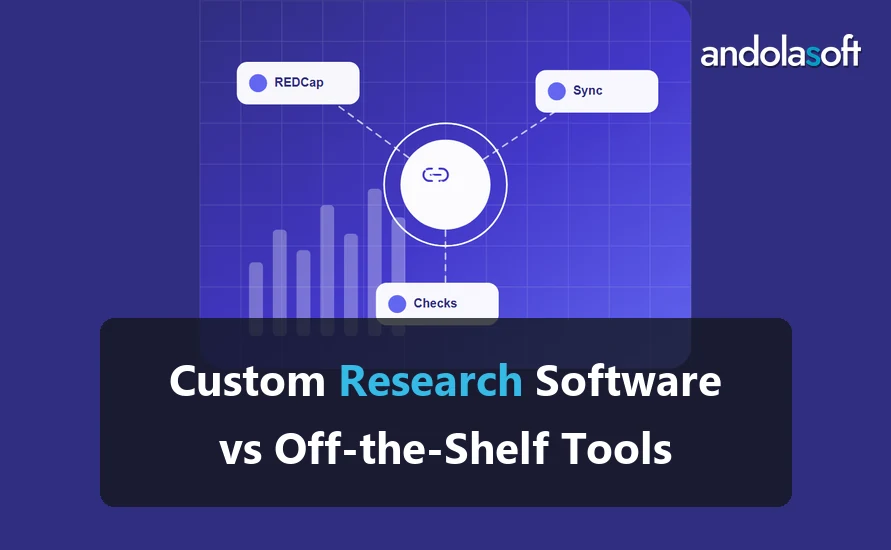
Buy an off-the-shelf research tool when it fits your workflow and your data rules with little change. Build custom research software when your study process is specific, when several tools must work together, or when access rules are hard to meet with a product. Answer four questions before you choose.

The choice is not about cost alone. Off-the-shelf tools are quick to start. Custom software fits your process better, but it needs ownership, documentation and support. Compare both on fit, data control, integration and long-term upkeep.

Question 1: Does a standard tool match your workflow?

List the steps a study takes, from participant intake to reporting. Mark each step that a standard tool covers without changes. If most steps are covered, buy. If the steps depend on local rules, such as consent types or sponsor reports, a standard tool will need workarounds.

Here is a worked example. A lab runs 4 studies. Each study has 3 consent types. A standard tool supports 2 consent types out of the box, so 2 of the 3 types fit. One consent type needs a custom form. That is 1 gap out of 3 for each study, or 4 gaps across the 4 studies. Four gaps is a signal to look at custom work, but it does not decide the question alone.

Question 2: Where must the data live?

Some research data cannot leave your environment. Check whether the tool hosts data in a region and under controls your policy allows. If the tool cannot meet your rules, a custom build on your infrastructure may be the only option.

Question 3: How many tools must work together?

If the answer needs data from a survey tool, an instrument export and a grant database, count the connections. Each connection is a point of failure. A custom build can join those sources in one place, with checks at each join.

Question 4: Who will maintain it in three years?

Every software choice has an upkeep cost. Off-the-shelf tools bring the vendor’s roadmap, which you do not control. Custom software needs an owner, documentation and a support plan. If nobody on your side can own a custom system, plan for a partner who will.

When to choose each option

Choose an off-the-shelf tool when the workflow is common, the data rules are standard and one vendor covers most needs. Choose custom software when the workflow is specific, several sources must join, or you need full control of the data. Many institutes use both: a standard tool for common tasks and a custom layer for the rest.

A checklist before you decide

Use this checklist with the people who run the studies, not only the IT team. Each question should get a clear yes or no before you compare options.

  • Does a standard tool cover at least most steps of the study workflow?
  • Can the tool meet your data hosting and access rules without custom work?
  • Can the tool export your records in an open format?
  • Does the vendor explain how it handles changes to its product?
  • Can your team name an owner for the system, whichever option you pick?

If you answer no to two or more questions, look seriously at a custom option. A single no often has a simple fix, such as a configuration change or a small connector.

What a vendor should answer

Ask a vendor where data is stored, who can see it, how long copies are kept and how exports work. Ask what happens to your data if you stop using the product. Good vendors answer these questions in writing. Vague answers are a warning sign, not a reason to walk away, but they should slow the decision.

The hidden cost of a custom build

A custom build has costs that appear after launch. Someone must fix bugs, apply updates, answer questions and plan changes. Estimate these costs before you build. A custom system with a support plan often costs less over time than a set of workarounds around a tool that does not fit.

FAQ

Is custom research software more expensive?

It can cost more to build, but the total depends on upkeep, the number of tools you replace and the staff time you save. Compare the full cost over the same period.

Can we start with a standard tool and move to custom later?

Yes. Keep your data in open formats and document the fields. That makes a later move far easier.

What should we ask a vendor before we buy?

Ask where data is hosted, who can access it, how exports work and how the product handles your consent types and reporting needs.

Next step

If your lab has specific steps that no tool covers, look at our research software development page. To test your own workflow against these four questions, book a discovery call.

How to Connect Research Databases to Analytics: A Step-by-Step Guide

TL;DR

To connect a research database to an analytics platform, define your metrics first, grant read-only access, check data quality, build a clean data model, build the dashboards, and document each metric. Start with one study and two or three metrics. Expand once the numbers match the source.

Research databases are built for storage and collection, not for reporting. Tables use codes, fields have gaps, and the same measure can be recorded in two places. Analytics works only after the data is cleaned and the metrics are defined.

Step 1: Define the metrics

Write each metric in plain words, then write its formula. For example, “enrolled participants: count of participants with a signed consent and a first visit date.” A metric without a formula will be calculated differently by each person who uses it.

Step 2: Grant read-only access

Create a database account that can read only the tables the dashboards need. Read-only access stops accidental changes to research records. Log which account the analytics platform uses.

Step 3: Check data quality

Run checks before you build anything. Count missing values for each field. Find duplicate participant records. Flag values outside the range the protocol allows.

Here is a worked example. A study table has 500 participant rows. Of these, 480 have a consent date, so 20 rows are missing one. Four rows appear twice under different IDs. Assume none of the duplicate rows is also missing a consent date. The enrolled count is then 476: 500 rows, minus 20 without a consent date, minus 4 duplicates. The dashboard must show that number, and the data team must confirm it.

Step 4: Build a clean data model

Create views or a small set of tables that hold one row per participant or per visit. Join the tables in one place. Keep the raw tables unchanged, so you can trace every number back to its source.

Step 5: Build the dashboards

Start with the questions researchers ask most often. Build one dashboard per study, then a summary across studies. Test each chart against the source query, and compare totals with the counts from Step 3.

Step 6: Document the metrics

Write down each metric’s definition, its source tables and its owner. Store the document next to the dashboards. When a metric changes, update the document first.

Common mistakes

Teams often build dashboards on raw tables. The charts look right until a duplicate or a missing field changes the total. Build the data model first, and keep the checks running after launch.

Choose a refresh schedule

A refresh schedule decides how often the dashboards read new data. Match it to how the study works. A daily refresh suits a recruitment dashboard. A weekly or monthly refresh suits a funder report that is reviewed on a fixed cycle. Refreshing more often than anyone reads the data adds cost and risk without adding value.

Record the time of each refresh on the dashboard. Researchers should see when the data was last updated, so they never mistake an old number for a current one.

Handle permissions in the analytics layer

Permissions should match the research database. A principal investigator should see the studies they run, and a reporting team should see only the summaries they need. Set these rules in the analytics platform, and test them with accounts that have limited access. Check that a restricted record does not leak through a filter, a drill-down or an export.

Review permissions when people join or leave a study. Stale access is one of the most common gaps in analytics setups.

Watch for drift

Drift happens when a source changes and the dashboards keep working but show the wrong thing. A renamed field, a new code value or a changed consent rule can change a total without any error message. Add a simple check that compares each headline number with its source every time the data loads. When a check fails, the dashboard should flag it rather than show a silent error.

Document each dashboard

Each dashboard needs a short note: the question it answers, the metrics it uses, the refresh time and the owner who can explain a number. Put the note on the dashboard itself. A researcher who finds a surprising number can then check the definition without asking the analyst who built it.

FAQ

Do we need a data engineer for this?

Most teams need someone who understands the database and the research protocol. A data engineer helps with the model and the checks.

Should dashboards read the database directly?

For small studies, yes, with read-only access. For larger work, a clean data model is safer and faster.

How often should we check the numbers?

Check after each data load, and compare totals with the source at a fixed schedule agreed with the study team.

Next step

Our scientific data analytics page explains how we scope this work. To connect your own research database, book a discovery call.

Modernizing Legacy Research Applications: What Institutes Should Do

TL;DR

Modernize a legacy research application in stages. First, assess what it does and where the data sits. Second, protect the data and access. Third, move the core workflows one at a time. Fourth, retire the old system once the new one has run in parallel. Do not rewrite everything at once.

A legacy research application still runs studies, but it is hard to change. Its original developer may have left, and its libraries may no longer receive updates. Modernization works best as a series of small, tested moves. Each move keeps the study running.

Start with an assessment

Write down what the application does, who uses it and which reports depend on it. Note the data it stores and the systems it connects to. The assessment should answer one question: which parts of the system must keep working during the change?

Protect the data before you change the code

Take a verified backup and test a restore before any change. Check who has access today, and remove accounts that no longer need it. Only then should you change code. Data protection comes first because it is the one step you cannot undo.

Move one workflow at a time

Pick the workflow with the highest risk or the most manual work. Rebuild that workflow in the new system, run both systems in parallel for a set period, and compare the results. Repeat for each workflow.

Here is a small example. An application has 6 workflows: intake, consent, scheduling, data entry, review and reporting. The team moves intake first, then consent. That leaves 4 workflows on the old system. Each move is complete when the parallel run shows the same outputs for the agreed sample.

Keep the parallel run honest

Use real records for the comparison, and agree the match rule before you start. A parallel run that compares only easy cases proves little. Log every difference and decide each one.

Retire the old system with a plan

Switch users to the new system, keep the old one read-only for a set period, and archive it with its documentation. Do not delete it until the archive has been tested.

Choose a target design without over-engineering

The target design should solve the problems the assessment found, and no more. Many teams add services, queues and new frameworks that the research team never needed. Start with a simple design: one application, one database and clear interfaces to the systems it must connect to. Add complexity only when a real need appears.

Write the target design down in one page. Include the data it stores, the users it serves and the systems it connects to. Review it with the researchers, not only with developers, because the researchers know which steps matter most.

Common risks during the change

The biggest risk is losing a rule that nobody wrote down. Old applications often hold checks that users rely on without knowing. Find these rules during the assessment by reading the code, testing the screens and asking the team which mistakes the system stops.

The second risk is a data mismatch between the old and new systems. The parallel run should catch it. The third risk is a change of staff during the project. Keep the documentation current so a new person can take over the work.

Keep the team involved

Modernization changes daily work. Involve the people who enter data, review results and write reports. Show them each workflow before it moves, and collect their corrections. A team that helped shape the change uses the new system more readily.

Measure success in terms the team recognizes

Choose two or three measures that the research team already tracks, such as the time to finish a data entry task or the number of records that need correction. Measure them before the change and after each stage. Share the results in plain language. If a measure does not improve, the team needs to know why before the next stage begins.

FAQ

How long does a modernization take?

It depends on the size of the application and the number of workflows. Plan in stages, and agree each stage’s exit test before you start.

Do we have to stop research while we modernize?

No. Run the old and new systems in parallel for each workflow until the new one proves itself.

What if the original developer is gone?

Start with a code review and a list of open issues. Document what the system does before you change it. That record is valuable even if you never change the code.

Next step

If a legacy research application is holding back your studies, read our research software maintenance page to see how ongoing support is scoped. To review your system and its risks, book a discovery call.