How to Leverage BI for BFSI Risk Monitoring & Compliance?

The BFSI sector operates in one of the most regulated and risk-sensitive environments in the global economy. Every transaction, customer interaction, and financial exposure is governed by regulatory frameworks that continue to evolve.

At the same time, digital banking, real-time payments, and fintech integrations have significantly increased operational complexity.

In this environment, BI for BFSI is no longer a reporting enhancement — it is a foundational capability.

Instead of relying on backward-looking reports and manual reconciliations, BFSI organizations are using BI to continuously monitor risk, validate compliance, and enable faster, more confident decision-making.

As a result, leadership teams gain visibility not only into what has happened, but also into what could happen next.

How BI for BFSI Enables Risk & Compliance

What BI for BFSI Really Means

BI refers to Business Intelligence platforms purpose-built to address the unique risk, compliance, and governance needs of banks, NBFCs, financial services firms, and insurance providers.

Unlike generic BI tools, these platforms are designed around regulatory metrics, risk-weighted analytics, and audit-ready data structures.

More importantly, BI for BFSI unifies data from core banking systems, transaction platforms, risk engines, and operational tools into a single intelligence layer.

This ensures that compliance officers, risk managers, and executives all operate from the same source of truth, eliminating inconsistencies and interpretation gaps.

Why Traditional Reporting Models No Longer Work

Many BFSI institutions still rely on static reports generated from siloed systems. While these reports satisfy basic reporting needs, they fail to support real-time risk and compliance oversight.

By the time issues surface in monthly or quarterly reviews, the damage is often already done.

Traditional reporting struggles because it is reactive, fragmented, and highly manual. Compliance teams spend excessive time compiling data, validating numbers, and responding to audit queries.

BI for BFSI replaces this inefficiency with continuous intelligence, allowing teams to focus on risk mitigation rather than data preparation.

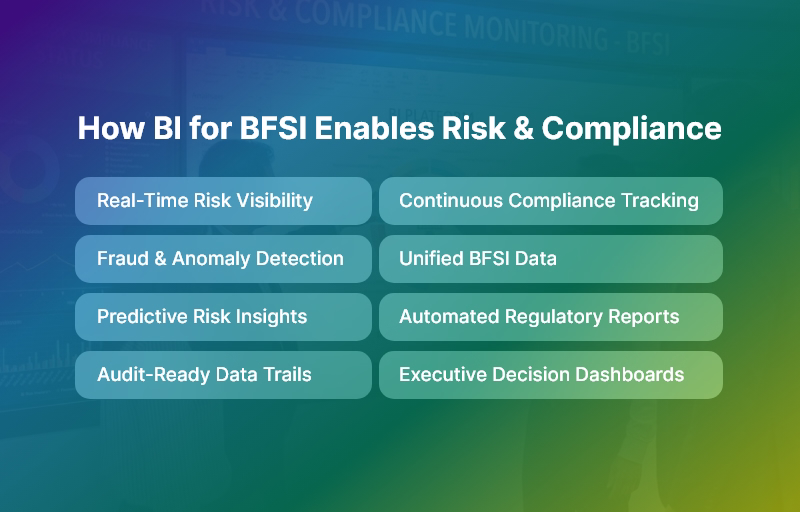
How BI for BFSI Supports Core Risk Monitoring

Credit Risk Management

Credit risk is dynamic by nature. Borrower behavior, economic conditions, and sectoral exposure change constantly.

BI for BFSI enables institutions to track these changes in near real time, providing early warning indicators before risks materialize.

Rather than waiting for defaults or overdue accounts, credit teams can proactively assess portfolio health, stress-test exposure, and rebalance risk.

This shift from reactive to predictive credit management is one of the most valuable outcomes of BI for BFSI adoption.

Market Risk Visibility

Market volatility directly impacts treasury operations, investment portfolios, and trading desks.

Small fluctuations in interest rates or foreign exchange markets can significantly affect profitability and capital adequacy.

With BI for BFSI, institutions gain continuous visibility into market exposure.

Real-time dashboards allow leadership to understand sensitivity, simulate adverse scenarios, and align risk appetite with actual market conditions.

Consequently, decisions become data-driven rather than assumption-based.

Operational Risk Control

Operational risk often emerges quietly — through process inefficiencies, system outages, or control failures. These risks are difficult to manage without integrated visibility across departments and branches.

BI for BFSI consolidates operational data, making it easier to identify recurring incidents, process bottlenecks, and control weaknesses.

Over time, organizations can correlate operational risk events with financial impact, enabling targeted improvements and stronger internal controls.

Fraud Risk Detection

Fraud risk has intensified with digital channels and real-time transactions. Manual review processes are no longer sufficient to detect sophisticated fraud patterns.

BI for BFSI enhances fraud monitoring by analyzing transaction behavior, identifying anomalies, and triggering alerts based on predefined risk thresholds.

This intelligence-led approach allows fraud teams to act faster, reduce losses, and improve customer trust.

Strengthening Compliance Through BI for BFSI

Compliance is no longer a periodic exercise. Regulators expect continuous oversight, transparency, and traceability.

BI enables this shift by embedding compliance monitoring directly into operational workflows.

Instead of checking compliance after the fact, institutions can continuously track regulatory thresholds, monitor policy adherence, and flag exceptions before violations occur.

This proactive approach significantly reduces regulatory risk and improves supervisory confidence.

Automated Regulatory Reporting and Audit Readiness

Regulatory reporting demands precision, consistency, and defensible data lineage. Manual reporting processes increase the risk of errors and audit findings.

With BI for BFSI, regulatory reports are generated directly from validated source data. Every metric is time-stamped, traceable, and version-controlled.

As a result, audit readiness becomes an outcome of daily operations rather than a last-minute effort.

Key Capabilities Required in BI for BFSI Platforms

To deliver real value, BI for BFSI platforms must include:

  • Unified data integration across core banking, ERP, CRM, and risk systems
  • Role-based dashboards for compliance, risk, and executive teams
  • Drill-down analytics for investigation and root-cause analysis
  • Predictive insights for emerging risk trends

These capabilities ensure BI supports governance and decision-making, not just visualization.

Best Practices for Implementing BI for BFSI

Successful BI initiatives begin with regulatory and risk priorities rather than dashboard design.

Organizations should standardize data definitions early, design role-specific KPIs, and automate alerts instead of relying solely on reports.

Most importantly, BI should be treated as a governance and control platform.

When aligned with compliance objectives, BI for BFSI becomes a long-term strategic asset rather than a short-term analytics project.

The Future of BI for BFSI

Looking ahead, BI for BFSI will increasingly incorporate AI-driven risk prediction, automated regulatory intelligence, and ESG risk monitoring.

As regulations become more complex and data volumes continue to grow, institutions with advanced BI capabilities will be better positioned to adapt, comply, and scale securely.

Final Thoughts: BI for BFSI as a Strategic Imperative

In today’s BFSI landscape, risk monitoring and compliance define institutional resilience.

Organizations that depend on fragmented reporting remain exposed to regulatory and operational shocks.

Those that adopt BI gain continuous visibility, predictive insight, and audit-ready governance.

By transforming data into intelligence, BI for BFSI enables banks and financial institutions to move faster, comply smarter, and operate with confidence in an increasingly regulated world.

How BI for Retail Helps Brands Optimize Inventory & Sales?

Retailers today face unpredictable consumer demand, rising costs, and fierce competition across every channel. Traditional reporting methods can’t keep up with rapid shifts in buying behavior and supply chain disruptions. This is where BI for Retail becomes a strategic game changer. It empowers retail leaders with real-time visibility into sales, stock, customers, and profitability — enabling faster and smarter decisions that drive performance.

This guide explains how BI for Retail transforms data into insights that help brands optimize inventory and maximize sales growth.

Top Benefits of BI for Retail

What is BI for Retail?

BI for Retail refers to the use of business intelligence tools, analytics, and data visualization designed specifically for retail operations. It consolidates data from:

→ Giving retailers a single source of truth for accurate, fast decision-making.

Why Retailers Need BI Today

Retail Challenge BI for Retail Solution
Overstocking or stockouts Smart demand forecasting & replenishment optimization
High inventory carrying costs Better space utilization & inventory turnover
Limited insights into product performance Real-time SKU profitability
Ineffective promotions Campaign analytics & customer response insights
Slow reporting & decision delays Instant dashboards & automated KPIs
Omnichannel visibility issues Unified analytics across online & offline

How BI Optimizes Inventory

BI ensures the right products are available at the right place and time — without excess waste.

Accurate Demand Forecasting

Predict future sales using:

  • Historical demand
  • Regional trends
  • External factors (weather, holidays)

➡ Lower stock imbalance & higher sell-through rates.

Real-Time Inventory Tracking

Centralized dashboards show exact inventory status across:

  • Stores
  • Warehouses
  • Online channels

➡ Faster replenishment & reduced lost sales.

Safety Stock Optimization

Analytics determine optimal stock buffers to avoid:

  • Stockouts
  • Rush orders
  • Customer dissatisfaction

Supplier Performance Insights

Measure vendor lead time, quality, and delivery reliability.

➡ Fewer delays + stronger procurement strategy.

Shrinkage & Waste Reduction

Retail BI detects:

  • Theft & pilferage patterns
  • Food/perishable spoilage
  • Storage inefficiencies

➡ Better bottom-line performance.

How BI Improves Sales Performance

Smarter Product Mix & Assortment Planning

Analyze:

  • Fast/slow movers
  • Store-level preferences
  • Cross-selling patterns

➡ Improve shelf productivity & margins.

Data-Driven Pricing Optimization

Use real-time pricing intelligence:

  • Margin impact
  • Competitor pricing
  • Customer elasticity

➡ Higher revenue with competitive pricing.

Promotion Analytics

Identify which offers truly drive:

  • Sales uplift
  • Repeat purchase
  • Basket value

➡ Stop spending on unproductive campaigns.

Customer Segmentation & Personalization

BI for Retail leverages RFM scoring to:

  • Reward loyal customers
  • Target offers precisely
  • Increase Customer Lifetime Value (CLV)

Omnichannel Performance Tracking

Bring together:

➡ Holistic insight into profitability across channels.

Key Retail KPIs Tracked Through BI

Inventory Metrics

  • Sell-through rate
  • Inventory turnover ratio
  • Days of inventory on hand
  • Stockout percentage

Sales Metrics

  • Gross margin return on investment (GMROI)
  • Basket size & conversion rate
  • Promo-driven sale percentage
  • Customer retention rate

➡ Retailers can monitor performance in real time.

Systems Integrated with BI

System Example Tools
POS Shopify POS, Square, Lightspeed
ERP SAP, Oracle, Tally
CRM Salesforce, HubSpot, Zoho
eCommerce Platforms Shopify, Magento, WooCommerce
Supply Chain Mgmt WMS, delivery analytics

Integration removes data silos for a unified retail intelligence ecosystem.

AI & Predictive Analytics in BI for Retail

Retail BI uses artificial intelligence to:

  • Predict future demand accurately
  • Suggest automated stock replenishment
  • Forecast the impact of promotions
  • Optimize pricing based on trends
  • Reduce overstock of declining products

➡ Better decisions with less manual effort.

BI for Multi-Location Retail

Benefit Business Impact
Store performance benchmarking Invest where growth is highest
Regional demand analysis Improve stock availability per location
Centralized analytics Consistent business reporting
Data-driven store expansion decisions Maximize ROI

Scalable intelligence for growth-oriented retail networks.

Short Case Example

A lifestyle retailer used BI for stock optimization:

Before BI After BI
22% lost sales due to stockouts <7% lost sales
Overpricing slow-moving stock Dynamic pricing increased sales
Manual, delayed reporting Real-time dashboards

Result: 12% revenue growth & increased customer satisfaction

Best Practices for BI for Retail Implementation

Best Practice Why It Matters
Prioritize clean and standardized data Accurate insights need reliable data
Define KPIs clearly Focus effort on business outcomes
Train teams for daily use Improve adoption across stores
Start with quick wins Build confidence in BI value
Scale to advanced analytics Predictive insights deliver higher ROI

Conclusion

Retail success now depends on data-driven agility — not guesswork.

BI for Retail helps brands:

  • Optimize inventory levels
  • Maximize sales and profitability
  • Improve customer satisfaction
  • Deliver an efficient omnichannel experience
  • Make informed, fast decisions at every level

Retailers that leverage BI for Retail build strong competitive advantages and unlock sustainable growth.

FAQs

How does BI for Retail help reduce stockouts?

It predicts demand and monitors inventory instantly, ensuring timely replenishment.

Can small retail businesses use BI?

Yes — cloud BI offers affordable, easy-to-adopt analytics.

How does BI improve retail profitability?

By optimizing pricing, reducing waste, and maximizing product performance.

What kind of data feeds BI?

POS, ERP, CRM, supply chain, and eCommerce data.

Does BI support omnichannel retail?

Absolutely — it unifies insights across online and in-store experiences.

BI and AI Explained: Turning Business Data into Predictive Intelligence

In today’s digital-first economy, data is no longer the differentiator — predictive intelligence is. Organizations generate massive volumes of data every day, yet many still struggle to turn that data into timely, actionable insights.

Traditional dashboards explain what happened, but modern businesses need answers to what will happen next. This is exactly where BI and AI come into play.

By combining Business Intelligence (BI) with Artificial Intelligence (AI), organizations can move beyond static reporting and unlock predictive intelligence — insights that anticipate trends, forecast outcomes, and recommend actions before problems arise.

As competition intensifies and decision cycles shorten, this capability has become mission-critical.

In this guide, you will learn how BI and AI works together, why it matters across industries, and how businesses can implement it successfully.

More importantly, you will see how Andolasoft helps organizations design, build, and scale predictive intelligence in data platforms that deliver real business outcomes — not just charts and dashboards.

Business intelligence and Artificial Intelligence Capabilities

Business Need & Importance of BI and AI

Modern businesses operate in environments defined by speed, complexity, and uncertainty. Customer expectations change rapidly, markets fluctuate, and operational risks emerge without warning.

In this context, relying on historical reports alone creates blind spots.

Why BI and AI Matters Today

BI and AI matters because it converts raw data into foresight. While BI organizes and visualizes structured data, AI analyzes patterns, learns from historical behavior, and predicts future outcomes. Together, they enable smarter, faster, and more confident decision-making.

Key business drivers include:

  • Exploding data volumes: Data from apps, IoT devices, CRMs, ERPs, and customer interactions is growing exponentially. Manual analysis simply cannot keep up.
  • Demand for real-time decisions: Leaders need insights now, not at the end of the month or quarter.
  • Competitive pressure: Companies that predict customer needs and operational risks earlier gain a clear advantage.

Industry-Specific Impact of BI and AI

Across industries, BI and AI is transforming how decisions are made:

  • Healthcare: Predictive analytics helps forecast patient admissions, detect anomalies in diagnostics, and optimize resource allocation.
  • eCommerce: AI-powered BI predicts demand, personalizes recommendations, and reduces cart abandonment through behavioral insights.
  • Logistics & Supply Chain: Companies forecast delays, optimize routes, and proactively manage inventory risks.
  • Fintech: Fraud detection models and credit risk predictions enhance security and regulatory compliance.
  • SaaS & Technology: Usage analytics and churn prediction enable proactive customer retention strategies.
  • Manufacturing: Predictive maintenance reduces downtime by identifying equipment failures before they occur.

Risks of Not Adopting BI and AI

Organizations that delay adoption face serious consequences:

  • Operational inefficiencies due to reactive decision-making
  • Revenue loss from missed opportunities and late responses
  • Security and compliance risks caused by delayed anomaly detection
  • Poor customer experience driven by generic, non-personalized interactions

Therefore, companies increasingly require strategic, scalable BI and AI solutions, not fragmented tools or legacy systems that fail to evolve with business needs.

Best Practices, Frameworks & Actionable Tips for BI and AI Implementation

Successfully implementing BI and AI requires more than tools — it demands the right strategy, architecture, and execution partner.

1. Start with Business Questions, Not Data

Successful BI and AI initiatives begin with clear business objectives. Instead of asking what data is available, define what decisions need improvement.

  • Identify high-impact use cases such as demand forecasting, churn prediction, or operational risk analysis.
  • Align analytics outputs directly with KPIs that leadership cares about.
  • Avoid building dashboards without a clear decision-making purpose.

2. Build a Strong Data Foundation

AI is only as good as the data it learns from. Data quality, consistency, and governance are non-negotiable.

  • Consolidate data from multiple sources into a centralized data warehouse or lake.
  • Standardize data definitions to eliminate reporting inconsistencies.
  • Implement strong data governance and access controls from day one.

3. Use the Right Architecture

A modern BI and AI architecture typically includes:

  • Data ingestion pipelines for real-time and batch data
  • Cloud-based data storage for scalability and performance
  • BI visualization layers for descriptive and diagnostic analytics
  • AI/ML models for predictive and prescriptive insights

This modular approach ensures flexibility as business needs evolve.

4. Combine Descriptive, Predictive, and Prescriptive Analytics

BI and AI works best when analytics maturity progresses in stages:

  • Descriptive analytics explains what happened.
  • Predictive analytics forecasts what will happen.
  • Prescriptive analytics recommends what actions to take next.

Skipping stages often leads to low adoption and mistrust in AI outputs.

5. Focus on Explainability and Trust

Business users must trust AI-generated insights.

  • Use explainable AI models where possible.
  • Clearly show which factors influenced predictions.
  • Provide confidence scores and scenario comparisons within dashboards.

6. Avoid Common BI and AI Mistakes

Common pitfalls include:

  • Treating AI as a plug-and-play feature rather than a continuous learning system.
  • Overengineering solutions before validating business value.
  • Ignoring change management and user adoption.

7. Quick Wins to Build Momentum

Low-effort, high-impact improvements include:

  • Automating anomaly detection in existing BI dashboards.
  • Adding predictive forecasts to sales and demand reports.
  • Using AI to prioritize leads or support tickets.

How Andolasoft Helps Implement BI and AI

Andolasoft delivers end-to-end BI and AI solutions tailored to business goals, not generic templates. Their expertise spans:

  • Custom Web Development for analytics platforms
  • SaaS Product Engineering with embedded BI and AI capabilities
  • BI, AI & Machine Learning Solutions for predictive intelligence
  • Data Analytics & Visualization for executive decision-making
  • Application Modernization to upgrade legacy BI systems
  • DevOps, Cloud & Automation for scalable, secure deployments

Choosing the right technology partner ensures long-term scalability, security, and ROI from BI and AI investments.

Customer Success Example: BI and AI in Action

For example, a mid-sized eCommerce company partnered with Andolasoft to modernize its analytics and forecasting capabilities. The company struggled with inventory overstocking, frequent stockouts, and delayed reporting that limited proactive decisions.

Andolasoft designed a BI and AI-driven predictive analytics platform that unified sales, customer behavior, and supply chain data into a single predictive intelligence layer. AI models were implemented to forecast product demand, identify high-risk SKUs, and recommend replenishment actions.

Within six months, the results were measurable:

  • 30% improvement in demand forecast accuracy
  • 25% reduction in inventory holding costs
  • 40% faster reporting cycles
  • Significantly improved executive visibility into future trends

Most importantly, decision-making shifted from reactive firefighting to predictive, data-driven planning.

Key Takeaways & Closing

To summarize, BI and AI represents a fundamental shift in how organizations use data:

  • BI provides clarity, while AI delivers foresight
  • Together, they enable predictive intelligence, not just reporting
  • Businesses across industries gain faster decisions, lower risk, and higher efficiency
  • Success depends on strategy, data quality, architecture, and execution

Adopting BI and AI now positions organizations to compete in a future where speed and predictive intelligence define winners. With the right approach and an experienced partner like Andolasoft, businesses can confidently turn data into a strategic asset — not an operational burden.

FAQs

1. What is BI and AI in simple terms?

BI and AI combine business intelligence reporting with artificial predictive intelligence to analyze data, predict outcomes, and recommend actions automatically.

2. How is BI and AI different from traditional BI?

Traditional BI focuses on historical data, while BI and AI adds predictive and prescriptive insights using machine learning models.

3. Which industries benefit most from BI and AI?

Healthcare, eCommerce, fintech, logistics, SaaS, manufacturing, and education see significant value from BI and AI adoption.

4. Is BI and AI only for large enterprises?

No. With cloud and modular architectures, BI and AI is now accessible and scalable for startups and mid-sized businesses.

5. How long does it take to implement BI and AI?

Initial use cases can go live in weeks, while full-scale implementations typically take a few months depending on complexity.

6. What data is required for BI and AI?

Structured and semi-structured data from CRMs, ERPs, applications, and operational systems form the foundation for BI and AI.

7. Why choose Andolasoft for BI and AI projects?

Andolasoft combines deep technical expertise, real-world delivery experience, and business-first thinking to deliver measurable BI and AI outcomes.

Top 10 BI Implementation Mistakes and How to Get It Right?

Business Intelligence initiatives promise data-driven decision-making, operational clarity, and competitive advantage — yet, industry studies consistently show that a significant percentage of BI projects fail to deliver expected ROI. The reason is rarely the technology itself. More often, it is BI implementation mistakes made early in planning, execution, and adoption.

In today’s data-saturated landscape, organizations generate massive volumes of structured and unstructured data across applications, platforms, and devices. However, without a well-defined BI strategy, this data becomes fragmented, unreliable, and underutilized. As a result, leaders make decisions based on incomplete insights, outdated reports, or manual spreadsheets.

This blog breaks down the top 10 BI implementation mistakes organizations make — and more importantly, how to avoid them. You will learn best practices, frameworks, and actionable strategies to build BI systems that scale, perform, and drive measurable outcomes.

Drawing from real-world delivery experience, Andolasoft helps businesses design, build, and modernize BI platforms that convert raw data into actionable intelligence — securely and sustainably.

Top BI Implementation Mistakes

Business Need & Importance of Avoiding BI Implementation Mistakes

Modern businesses operate in environments where speed, accuracy, and insight define success. From healthcare providers optimizing patient outcomes to eCommerce brands improving conversions, BI has become a strategic necessity rather than a reporting add-on.

However, many organizations still struggle because of BI implementation mistakes, such as disconnected data sources, poorly defined metrics, and lack of stakeholder alignment. These issues lead to dashboards that look impressive but fail to answer real business questions.

Why BI matters today:

  • Healthcare: Enables predictive analytics, operational efficiency, and compliance reporting — without compromising data security.
  • eCommerce & SaaS: Drives personalization, churn reduction, and revenue forecasting through real-time insights.
  • Logistics & Manufacturing: Improves demand forecasting, inventory optimization, and cost control.
  • Fintech & Education: Ensures transparency, risk management, and performance tracking across complex systems.

Risks of poor BI implementation:

  • Inefficient decision-making due to inconsistent or inaccurate data
  • Security vulnerabilities caused by unmanaged data access
  • Low user adoption when BI tools are complex or irrelevant
  • Revenue loss from delayed insights and reactive strategies

Therefore, companies must move beyond patchwork tools and legacy reporting. They need modern, scalable BI solutions designed with clear business alignment — something Andolasoft specializes in through its BI, data analytics, and digital transformation services.

Top 10 BI Implementation Mistakes

1. Lack of Clear Business Objectives

Many BI projects start with tools instead of outcomes. Without defined goals, dashboards become cluttered and unused.

Best practice: Align BI initiatives with KPIs such as revenue growth, operational efficiency, or customer retention.

2. Poor Data Quality and Governance

Inconsistent, duplicate, or outdated data undermines trust in BI systems.

Best practice: Implement strong data governance, validation rules, and ownership models early.

3. Ignoring End-User Needs

BI built only for leadership often fails adoption at operational levels.

Best practice: Design role-based dashboards tailored for executives, managers, and frontline teams.

4. Overcomplicated Architecture

Excessive tools, pipelines, and integrations increase maintenance costs.

Best practice: Use modular, cloud-ready architectures with scalable data pipelines.

5. Underestimating Change Management

Users resist BI if it disrupts workflows without training.

Best practice: Invest in onboarding, documentation, and continuous enablement.

6. Choosing the Wrong Tech Stack

Not all BI tools fit all use cases.

Best practice: Select tools based on data volume, latency, security, and integration needs.

7. No Real-Time or Near-Real-Time Capabilities

Static reports limit agility.

Best practice: Enable real-time dashboards for critical business functions.

8. Weak Security & Compliance Planning

BI systems often expose sensitive data.

Best practice: Apply role-based access control, encryption, and compliance frameworks.

9. Failing to Plan for Scale

What works for 10 users fails at 1,000.

Best practice: Architect BI for future growth in users, data sources, and analytics complexity.

10. Treating BI as a One-Time Project

BI requires continuous evolution.

Best practice: Adopt an iterative improvement model with regular feedback loops.

Customer Success

For example, a mid-sized eCommerce SaaS company partnered with Andolasoft to overcome recurring BI implementation mistakes that limited visibility into customer behavior and revenue trends.

The company struggled with siloed data across CRM, marketing automation, and finance tools. Reports were manually generated, often inconsistent, and delayed by weeks.

Andolasoft designed a unified BI architecture that integrated all data sources into a centralized analytics platform. Role-based dashboards were created for leadership, marketing, and operations teams. Automated pipelines ensured real-time data availability with built-in governance and security controls.

Results within 4 months:

  • 35% faster decision-making cycles
  • 28% improvement in campaign ROI
  • 50% reduction in manual reporting effort
  • Single source of truth across departments

The transformation allowed leadership to shift from reactive decisions to proactive, insight-led strategies — demonstrating the value of avoiding common BI implementation mistakes with the right technology partner.

Key Takeaways & Closing

Successful BI initiatives are not about dashboards — they are about decisions, outcomes, and impact. Most failures stem from avoidable BI implementation mistakes, including unclear goals, poor data quality, and lack of user adoption.

The most important takeaways:

  • Start with business objectives, not tools
  • Invest in data governance and security
  • Design BI for users, scale, and continuous improvement
  • Choose experienced partners who understand both technology and business

As data complexity grows, organizations that modernize BI thoughtfully will gain a decisive advantage. With deep expertise in BI, AI, data analytics, SaaS engineering, and digital transformation, Andolasoft helps businesses build future-ready BI platforms that deliver lasting value.

Avoid the pitfalls. Build BI the right way — starting now.

FAQs

1. What are the most common BI implementation mistakes?

The most common BI implementation mistakes include unclear objectives, poor data quality, low user adoption, and lack of scalability planning.

2. Why do BI projects fail despite good tools?

BI fails due to strategy, governance, and adoption issues — not because of tools. Avoiding BI implementation mistakes requires business alignment.

3. How long does a successful BI implementation take?

A well-planned BI implementation typically takes 3–6 months, depending on data complexity and integration scope.

4. How can companies improve BI adoption?

User-centric design, role-based dashboards, and training significantly improve BI adoption.

5. Is cloud BI better for modern businesses?

Yes. Cloud BI offers scalability, cost efficiency, and faster deployment when implemented correctly.

6. How does Andolasoft support BI initiatives?

Andolasoft provides end-to-end BI services, including strategy, architecture, development, analytics, and ongoing optimization.

7. Can BI be integrated with AI and machine learning?

Absolutely. Modern BI platforms integrate AI and ML for predictive insights, anomaly detection, and automation.

Top 10 Differences Between BI & Data Analytics

In today’s data-driven economy, organizations generate more data than ever before. According to industry research, enterprises analyze less than 30% of the data they collect, leaving valuable insights untapped. This challenge has made analytics-driven decision-making a boardroom priority.

However, one critical confusion persists across leadership teams: BI vs Data Analytics. While these terms are often used interchangeably, they serve distinct business purposes, operate at different levels of maturity, and answer fundamentally different questions.

Understanding the difference between BI vs Data Analytics is no longer optional. For CTOs, founders, and product leaders, this clarity directly impacts investment decisions, platform selection, team structure, and long-term scalability.

In this blog, you’ll learn the top 10 differences between BI vs Data Analytics, real-world use cases across industries, best practices for implementation, and how organizations can combine both for maximum impact. You’ll also see how Andolasoft, with deep expertise in BI, AI, machine learning, and data analytics, helps businesses design future-ready data ecosystems that drive measurable outcomes.

Top 10 Differences Between BI and Data Analytics

Business Need & Importance of Understanding BI vs Data Analytics

Modern organizations operate in an environment defined by speed, competition, and constant change. As a result, leadership teams need accurate insights, predictive intelligence, and real-time visibility to stay ahead. This is where understanding BI vs Data Analytics becomes critical.

Why This Distinction Matters Today

Business Intelligence focuses on what has already happened, while Data Analytics goes further to explain why it happened and what is likely to happen next. Companies that fail to distinguish between the two often invest in tools that don’t align with their goals, resulting in low adoption and poor ROI.

Industry-Wide Challenges

  • Healthcare organizations struggle with historical reporting but need predictive analytics for patient outcomes and capacity planning.
  • eCommerce companies rely on BI dashboards for sales tracking but require advanced analytics for personalization and demand forecasting.
  • Logistics and supply chain firms need BI for operational visibility, yet analytics for route optimization and risk prediction.
  • Fintech and SaaS companies depend on BI for compliance reporting while using analytics for fraud detection and churn reduction.
  • Manufacturing enterprises use BI for production reporting and analytics for predictive maintenance.

Risks of Not Modernizing

Organizations that rely only on legacy BI or fragmented analytics face serious risks:

  • Delayed decision-making due to static reports
  • Revenue loss from missed predictive opportunities
  • Operational inefficiencies and higher costs
  • Poor customer experiences due to lack of personalization
  • Inability to scale analytics across teams

Therefore, businesses need strategic, integrated data platforms instead of patchwork tools. This is where a trusted technology partner like Andolasoft plays a vital role in aligning BI vs Data Analytics with business objectives.

Top 10 Differences Between BI vs Data Analytics

1. Purpose and Core Objective

  • Business Intelligence (BI) primarily focuses on monitoring past and present performance through dashboards, KPIs, and standardized reports.
  • Data Analytics, on the other hand, aims to discover patterns, uncover root causes, and predict future outcomes using advanced analytical techniques.

2. Type of Questions Answered

  • BI answers “What happened?” and “What is happening now?”, enabling descriptive insights.
  • Data Analytics answers “Why did it happen?” and “What will happen next?”, enabling diagnostic and predictive insights.

3. Data Complexity and Depth

  • BI works best with structured, clean, and historical data from data warehouses.
  • Data Analytics handles large, complex, and unstructured datasets, including logs, text, IoT data, and behavioral data.

4. Tools and Technologies Used

  • BI relies on tools like Power BI, Tableau, Looker, and Superset for visualization and reporting.
  • Data Analytics uses Python, R, SQL, Spark, ML frameworks, and AI models for deep analysis.

5. User Base and Skill Requirements

  • BI is designed for business users, executives, and operational teams with minimal technical skills.
  • Data Analytics is driven by data analysts, data scientists, and engineers with strong statistical and programming expertise.

6. Time Orientation

  • BI is historical and real-time, focusing on trends and current performance.
  • Data Analytics is forward-looking, emphasizing forecasting, simulation, and optimization.

7. Level of Automation

  • BI dashboards require manual interpretation and predefined metrics.
  • Data Analytics enables automated insights, anomaly detection, and recommendations through AI and ML.

8. Business Impact Scope

  • BI supports operational efficiency and management reporting.
  • Data Analytics drives strategic transformation, innovation, and competitive advantage.

9. Scalability and Flexibility

  • BI solutions are often rigid, built around fixed KPIs.
  • Data Analytics platforms are highly scalable and flexible, evolving with business needs.

10. Decision-Making Power

  • BI enables reactive decision-making based on known metrics.
  • Data Analytics empowers proactive and predictive decision-making with higher accuracy.

Best Practices, Frameworks & Actionable Tips for BI vs Data Analytics

Step-by-Step Recommendations

  • Define business objectives first, then decide whether BI, Data Analytics, or both are required.
  • Establish a single source of truth using centralized data warehouses or data lakes.
  • Adopt modular architectures that allow BI and analytics to coexist seamlessly.

Best Practices

  • Standardize KPIs for BI to ensure consistency across teams and departments.
  • Invest in data quality and governance, as analytics accuracy depends on clean data.
  • Enable self-service BI while maintaining controlled access to advanced analytics.

Frameworks & Architectures

  • Modern Data Stack (ETL/ELT, cloud data warehouse, BI layer, analytics layer).
  • Lakehouse Architecture for combining BI reporting and advanced analytics.
  • MLOps frameworks to operationalize analytics models at scale.

Do’s and Don’ts

  • Do align BI dashboards with business outcomes, not vanity metrics.
  • Do not overcomplicate BI with unnecessary analytics models.
  • Avoid siloed tools that prevent data sharing across teams.

Quick Wins

  • Automate recurring BI reports to save time.
  • Introduce predictive analytics for high-impact use cases like churn or demand forecasting.

How Andolasoft Helps

Andolasoft enables organizations to implement BI vs Data Analytics effectively through:

  • Custom Web & Mobile Development for analytics-driven applications
  • SaaS Product Engineering with embedded BI and analytics
  • BI, AI & Machine Learning Solutions for predictive intelligence
  • Data Analytics & Application Modernization for legacy systems
  • DevOps, Cloud & Automation for scalable performance

Choosing Andolasoft ensures faster implementation, lower risk, and measurable business value.

Customer Success

For example, a mid-sized healthcare SaaS provider, partnered with Andolasoft to modernize its reporting and analytics platform. Initially, the company relied solely on BI dashboards to track patient engagement and operational metrics.

Andolasoft implemented a unified BI vs Data Analytics solution, combining real-time dashboards with predictive analytics models. Within four months, achieved:

  • 35% faster reporting cycles
  • 25% reduction in operational inefficiencies
  • Improved patient outcome predictions by 40%
  • Higher adoption of analytics across leadership teams

By integrating BI for visibility and Data Analytics for prediction, transformed decision-making from reactive to proactive.

Key Takeaways & Closing

Understanding the difference between BI vs Data Analytics is essential for modern businesses.

  • BI delivers clarity on past and present performance.
  • Data Analytics unlocks predictive and prescriptive intelligence.
  • Together, they create a powerful foundation for data-driven growth.

Organizations that adopt both strategically gain better visibility, smarter decisions, and sustainable competitive advantage. With the right partner, businesses can avoid common pitfalls and maximize ROI.

Andolasoft brings proven expertise in BI vs Data Analytics, helping organizations design, build, and scale intelligent data solutions that drive real outcomes.

FAQs

1. What is the main difference between BI vs Data Analytics?

BI focuses on historical reporting and dashboards, while Data Analytics emphasizes predictive and diagnostic insights using advanced techniques.

2. Can BI and Data Analytics work together?

Yes. Combining BI vs Data Analytics enables organizations to track performance and predict future outcomes effectively.

3. Which is better for executives: BI or Data Analytics?

Executives typically rely on BI for quick insights, while analytics supports strategic forecasting and long-term planning.

4. Is Data Analytics more expensive than BI?

Data Analytics often requires more skilled resources, but it delivers higher strategic value when implemented correctly.

5. Do small businesses need BI vs Data Analytics?

Yes. Even small businesses benefit from BI dashboards and targeted analytics for growth and efficiency.

6. How does Andolasoft help with BI vs Data Analytics?

Andolasoft designs end-to-end BI and analytics solutions, from data engineering to AI-driven insights.

7. When should a company move beyond BI to Data Analytics?

When businesses need forecasting, automation, and deeper insights beyond descriptive reporting, Data Analytics becomes essential.