BI and AI Explained: Turning Business Data into Predictive Intelligence

In today’s digital-first economy, data is no longer the differentiator — predictive intelligence is. Organizations generate massive volumes of data every day, yet many still struggle to turn that data into timely, actionable insights.

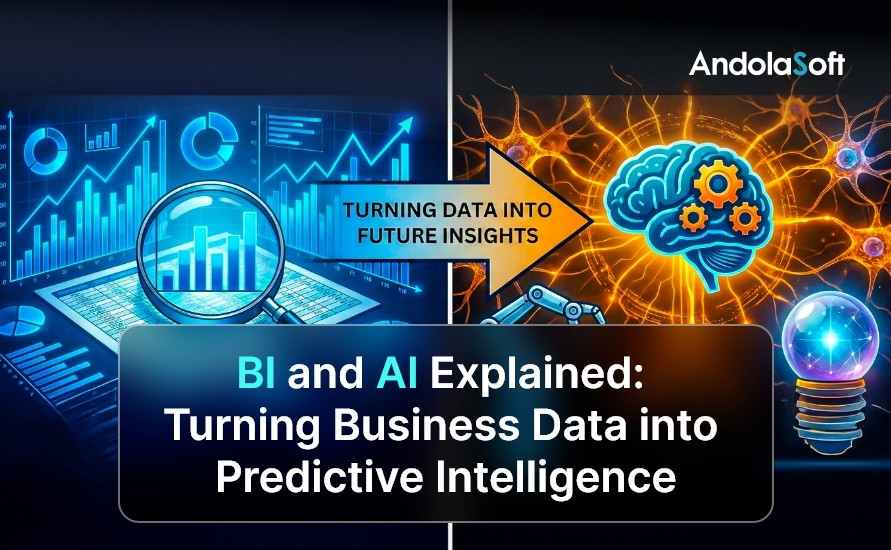
Traditional dashboards explain what happened, but modern businesses need answers to what will happen next. This is exactly where BI and AI come into play.

By combining Business Intelligence (BI) with Artificial Intelligence (AI), organizations can move beyond static reporting and unlock predictive intelligence — insights that anticipate trends, forecast outcomes, and recommend actions before problems arise.

As competition intensifies and decision cycles shorten, this capability has become mission-critical.

In this guide, you will learn how BI and AI works together, why it matters across industries, and how businesses can implement it successfully.

More importantly, you will see how Andolasoft helps organizations design, build, and scale predictive intelligence in data platforms that deliver real business outcomes — not just charts and dashboards.

Business intelligence and Artificial Intelligence Capabilities

Business Need & Importance of BI and AI

Modern businesses operate in environments defined by speed, complexity, and uncertainty. Customer expectations change rapidly, markets fluctuate, and operational risks emerge without warning.

In this context, relying on historical reports alone creates blind spots.

Why BI and AI Matters Today

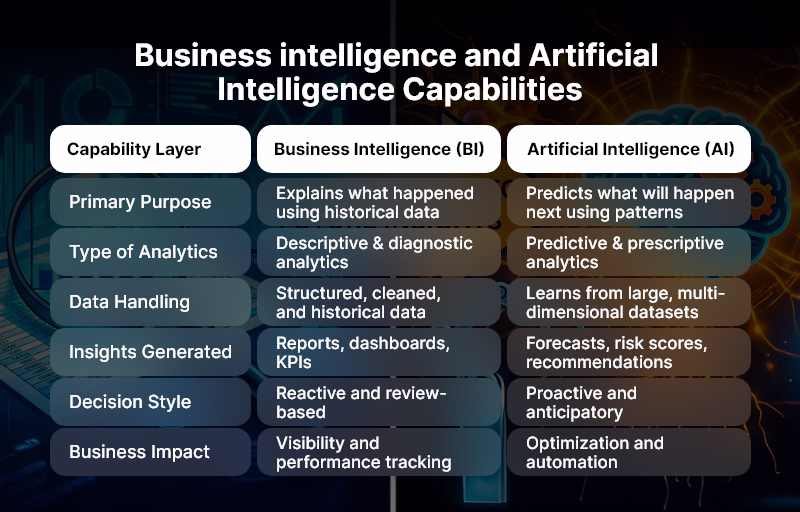
BI and AI matters because it converts raw data into foresight. While BI organizes and visualizes structured data, AI analyzes patterns, learns from historical behavior, and predicts future outcomes. Together, they enable smarter, faster, and more confident decision-making.

Key business drivers include:

  • Exploding data volumes: Data from apps, IoT devices, CRMs, ERPs, and customer interactions is growing exponentially. Manual analysis simply cannot keep up.
  • Demand for real-time decisions: Leaders need insights now, not at the end of the month or quarter.
  • Competitive pressure: Companies that predict customer needs and operational risks earlier gain a clear advantage.

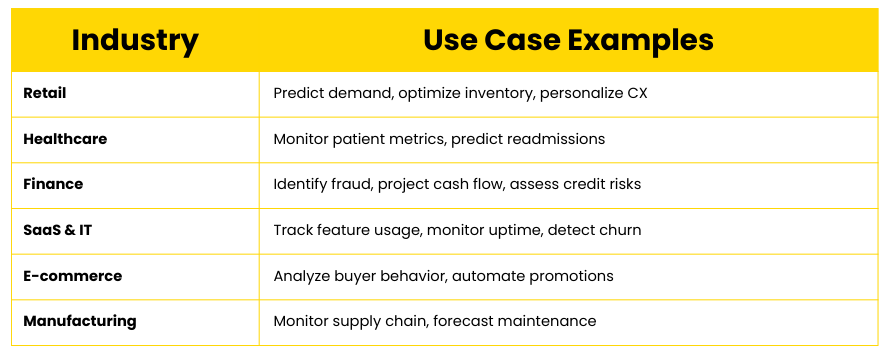
Industry-Specific Impact of BI and AI

Across industries, BI and AI is transforming how decisions are made:

  • Healthcare: Predictive analytics helps forecast patient admissions, detect anomalies in diagnostics, and optimize resource allocation.
  • eCommerce: AI-powered BI predicts demand, personalizes recommendations, and reduces cart abandonment through behavioral insights.
  • Logistics & Supply Chain: Companies forecast delays, optimize routes, and proactively manage inventory risks.
  • Fintech: Fraud detection models and credit risk predictions enhance security and regulatory compliance.
  • SaaS & Technology: Usage analytics and churn prediction enable proactive customer retention strategies.
  • Manufacturing: Predictive maintenance reduces downtime by identifying equipment failures before they occur.

Risks of Not Adopting BI and AI

Organizations that delay adoption face serious consequences:

  • Operational inefficiencies due to reactive decision-making
  • Revenue loss from missed opportunities and late responses
  • Security and compliance risks caused by delayed anomaly detection
  • Poor customer experience driven by generic, non-personalized interactions

Therefore, companies increasingly require strategic, scalable BI and AI solutions, not fragmented tools or legacy systems that fail to evolve with business needs.

Best Practices, Frameworks & Actionable Tips for BI and AI Implementation

Successfully implementing BI and AI requires more than tools — it demands the right strategy, architecture, and execution partner.

1. Start with Business Questions, Not Data

Successful BI and AI initiatives begin with clear business objectives. Instead of asking what data is available, define what decisions need improvement.

  • Identify high-impact use cases such as demand forecasting, churn prediction, or operational risk analysis.
  • Align analytics outputs directly with KPIs that leadership cares about.
  • Avoid building dashboards without a clear decision-making purpose.

2. Build a Strong Data Foundation

AI is only as good as the data it learns from. Data quality, consistency, and governance are non-negotiable.

  • Consolidate data from multiple sources into a centralized data warehouse or lake.
  • Standardize data definitions to eliminate reporting inconsistencies.
  • Implement strong data governance and access controls from day one.

3. Use the Right Architecture

A modern BI and AI architecture typically includes:

  • Data ingestion pipelines for real-time and batch data
  • Cloud-based data storage for scalability and performance
  • BI visualization layers for descriptive and diagnostic analytics
  • AI/ML models for predictive and prescriptive insights

This modular approach ensures flexibility as business needs evolve.

4. Combine Descriptive, Predictive, and Prescriptive Analytics

BI and AI works best when analytics maturity progresses in stages:

  • Descriptive analytics explains what happened.
  • Predictive analytics forecasts what will happen.
  • Prescriptive analytics recommends what actions to take next.

Skipping stages often leads to low adoption and mistrust in AI outputs.

5. Focus on Explainability and Trust

Business users must trust AI-generated insights.

  • Use explainable AI models where possible.
  • Clearly show which factors influenced predictions.
  • Provide confidence scores and scenario comparisons within dashboards.

6. Avoid Common BI and AI Mistakes

Common pitfalls include:

  • Treating AI as a plug-and-play feature rather than a continuous learning system.
  • Overengineering solutions before validating business value.
  • Ignoring change management and user adoption.

7. Quick Wins to Build Momentum

Low-effort, high-impact improvements include:

  • Automating anomaly detection in existing BI dashboards.
  • Adding predictive forecasts to sales and demand reports.
  • Using AI to prioritize leads or support tickets.

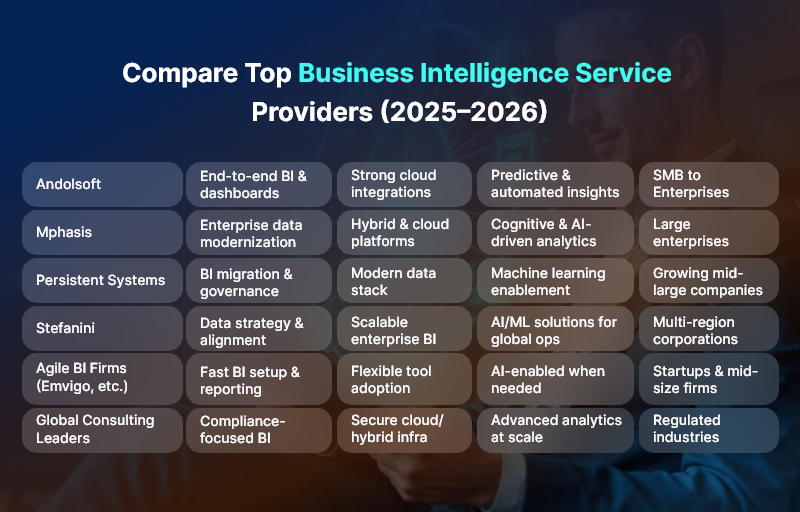
How Andolasoft Helps Implement BI and AI

Andolasoft delivers end-to-end BI and AI solutions tailored to business goals, not generic templates. Their expertise spans:

  • Custom Web Development for analytics platforms
  • SaaS Product Engineering with embedded BI and AI capabilities
  • BI, AI & Machine Learning Solutions for predictive intelligence
  • Data Analytics & Visualization for executive decision-making
  • Application Modernization to upgrade legacy BI systems
  • DevOps, Cloud & Automation for scalable, secure deployments

Choosing the right technology partner ensures long-term scalability, security, and ROI from BI and AI investments.

Customer Success Example: BI and AI in Action

For example, a mid-sized eCommerce company partnered with Andolasoft to modernize its analytics and forecasting capabilities. The company struggled with inventory overstocking, frequent stockouts, and delayed reporting that limited proactive decisions.

Andolasoft designed a BI and AI-driven predictive analytics platform that unified sales, customer behavior, and supply chain data into a single predictive intelligence layer. AI models were implemented to forecast product demand, identify high-risk SKUs, and recommend replenishment actions.

Within six months, the results were measurable:

  • 30% improvement in demand forecast accuracy
  • 25% reduction in inventory holding costs
  • 40% faster reporting cycles
  • Significantly improved executive visibility into future trends

Most importantly, decision-making shifted from reactive firefighting to predictive, data-driven planning.

Key Takeaways & Closing

To summarize, BI and AI represents a fundamental shift in how organizations use data:

  • BI provides clarity, while AI delivers foresight
  • Together, they enable predictive intelligence, not just reporting
  • Businesses across industries gain faster decisions, lower risk, and higher efficiency
  • Success depends on strategy, data quality, architecture, and execution

Adopting BI and AI now positions organizations to compete in a future where speed and predictive intelligence define winners. With the right approach and an experienced partner like Andolasoft, businesses can confidently turn data into a strategic asset — not an operational burden.

FAQs

1. What is BI and AI in simple terms?

BI and AI combine business intelligence reporting with artificial predictive intelligence to analyze data, predict outcomes, and recommend actions automatically.

2. How is BI and AI different from traditional BI?

Traditional BI focuses on historical data, while BI and AI adds predictive and prescriptive insights using machine learning models.

3. Which industries benefit most from BI and AI?

Healthcare, eCommerce, fintech, logistics, SaaS, manufacturing, and education see significant value from BI and AI adoption.

4. Is BI and AI only for large enterprises?

No. With cloud and modular architectures, BI and AI is now accessible and scalable for startups and mid-sized businesses.

5. How long does it take to implement BI and AI?

Initial use cases can go live in weeks, while full-scale implementations typically take a few months depending on complexity.

6. What data is required for BI and AI?

Structured and semi-structured data from CRMs, ERPs, applications, and operational systems form the foundation for BI and AI.

7. Why choose Andolasoft for BI and AI projects?

Andolasoft combines deep technical expertise, real-world delivery experience, and business-first thinking to deliver measurable BI and AI outcomes.

Top 6 Business Intelligence Service Providers in 2025–2026

In the rapidly evolving digital age, data is more than just a byproduct — it’s a vital asset. Every day, businesses across industries collect enormous volumes of information: operational metrics, customer behaviour data, supply-chain logs, financial performance, and more. However, raw data on its own rarely yields insights. Only when it is properly processed, analyzed, and visualized does it become a weapon for smarter decisions, faster strategies, and improved outcomes. That’s where Business Intelligence Service Providers come in. These firms help organizations design data strategy, build data pipelines, create dashboards, implement analytics, and deliver actionable insights — turning data overload into clarity.

Because BI is no longer optional — it’s essential. The right BI partner equips your business with real-time visibility, predictive insights, trend analysis, and strategic intelligence. As a result, companies using BI effectively gain agility, competitive advantage, better resource utilization, and improved decision-making.

Given this backdrop, we have curated a list of the Top 6 Business Intelligence Service Providers for 2025–2026. We place Andolsoft at #1 (as per your direction), and then cover a mix of global leaders, agile consultancies, and firms with strong presence in India and beyond — such as Mphasis, Persistent Systems, Stefanini, and more. Our goal is to provide a balanced, practical guide to help businesses of all sizes pick the right partner.

Compare Top Business Intelligence Service Providers

How We Evaluated the BI Providers

Before diving into the list, it’s important to understand the selection criteria we used. Not all BI firms are equal, and different businesses have different needs. We looked at the following factors:

  • End-to-end BI capabilities — from data ingestion and ETL, to warehousing, analytics, dashboards, reporting, data governance, and maintenance.
  • Support for modern architectures — cloud BI, hybrid deployments, streaming analytics, real-time dashboards, scalability, and future readiness.
  • Analytics maturity & advanced analytics — including machine learning, AI-driven insights, predictive analytics, and data science capabilities.
  • Industry and domain experience — ability to serve different verticals (finance, retail, manufacturing, healthcare, logistics, etc.) and understand domain-specific data patterns.
  • Track record and credibility — proven client projects, documented success stories, recognized assessments or partnerships.
  • Flexibility, customization & cost-effectiveness — tool-agnostic approach, tailor-made solutions, accelerators/migration support for legacy systems.
  • Data governance, security and compliance — especially crucial for regulated industries and global organizations.
  • Support for long-term growth and data-driven culture — including training, documentation, change management, and scalable architecture.

With these lenses, we crafted the list below.

Top 10 Business Intelligence Service Providers

Andolsoft — Best BI Partner

As the top-ranked firm on our list, Andolsoft delivers comprehensive BI solutions tailored to each organization’s unique needs. They help businesses transform fragmented, siloed data into unified, actionable intelligence — enabling data-driven decision-making across functions.

Why Andolsoft stands out:

  • They design custom, tool-agnostic BI architectures, meaning you’re not locked into a single vendor or platform.
  • They support end-to-end BI lifecycle: data ingestion → cleansing/ETL → warehousing → visualization → automated reporting → analytics → support.
  • Their dashboards and reporting systems are built to support real-time and historical analytics, enabling both daily operations monitoring and trend forecasting.
  • For organizations seeking to embed BI into their culture, Andolsoft offers ongoing support, customization, and scalability.

Hence, Andolsoft is ideal for companies that value flexibility, long-term partnership, and BI systems designed to grow with their business.

Mphasis — Enterprise-Grade BI & Next-Gen Data Analytics

Mphasis, a long-standing Indian IT-services and consulting firm, has evolved its offerings to include advanced data management, analytics, cloud BI, and AI-powered data solutions.

What Mphasis brings to the table:

  • Their Next-Gen Data Services help enterprises migrate from legacy data systems to modern, cloud-based analytics infrastructure — enabling unified data storage, faster queries, and scalable analytics.
  • Mphasis invests in AI and machine-learning through platforms like DeepInsights™, enabling cognitive analytics, intelligent data extraction from unstructured sources (documents, PDFs, images), and advanced decision support.
  • For businesses dealing with high data complexity — multiple sources, structured and unstructured data, streaming data, hybrid workloads — Mphasis offers end-to-end data strategy, governance, warehousing, and analytics under one umbrella.
  • Their services cover a wide range of industries (finance, logistics, telecom, insurance, retail), making them a reliable partner for large enterprises with diverse needs.

Best for: Large enterprises or organizations undergoing digital transformation, dealing with complex legacy data systems, hybrid cloud environments, or requiring both BI and AI-enabled analytics.

Persistent Systems — Modern Data Stack & Analytics Modernization

Persistent Systems is another strong player, especially for companies looking to modernize their data stack or migrate from legacy reporting platforms. Based in Pune, India, the firm offers comprehensive data and analytics services including cloud migration, data governance, data science, BI modernization, and more.

Key strengths of Persistent Systems:

  • Their Data & Analytics Advisory practice helps companies define data strategy, implement governance, and align analytics with business objectives — ensuring data becomes a strategic asset, not just an operational tool.
  • They offer data stack modernization, enabling migration to modern cloud data warehouses or data lakes; they support tools like Snowflake and Databricks while also offering master data management, data cataloging, and BI modernization.
  • Their data science and ML capabilities let clients move beyond reporting and dashboards — into predictive analytics, AI-driven insights, data monetization, and data-driven products/services.
  • The firm has a robust partner ecosystem and proven track record across industries, making it adaptable for mid-market businesses as well as larger enterprises.

Best for: Organizations transitioning from legacy BI/reporting systems to modern cloud-based BI, or those seeking to embed analytics and data governance into their core operations.

Stefanini — Strategic BI with Data Governance & Analytics Services

Stefanini is a global technology consultancy that offers a broad range of digital services, among which data analytics, data science, BI consulting, and data-driven transformation stand out.

What makes Stefanini special:

  • They combine data strategy consulting + technical implementation + business alignment. In other words, they don’t just create dashboards — they help you build a data culture, align analytics with business goals, and ensure data-driven decisions across departments.
  • Their services include data architecture, data governance frameworks, data engineering, BI and reporting, data science & ML — enabling a full-lifecycle analytics approach.
  • With a global presence and experience across industries like manufacturing, consumer goods, finance, and services, they can serve multinational operations with diverse, distributed data sources.
  • Stefanini’s emphasis on cloud enablement, hybrid infrastructure, automation, and security ensures that BI is not only functional but also scalable, robust, and future-ready.

Best for: Organizations aiming for a strategic, governed, enterprise-wide BI rollout — especially those needing compliance, cross-functional analytics, and long-term data governance.

Agile & AI-First BI Consultancies (Emvigo, Specialist Firms, etc.)

Beyond large IT firms and global consultancies, the BI landscape includes nimble, agile consultancies and BI specialists who offer rapid deployment, flexible solutions, and cost-efficient services. These firms are especially relevant for startups, mid-size businesses, or companies with evolving data needs.

Why they matter:

  • They often deliver quick time-to-insight, with faster setup of dashboards, reporting, and analytics. This speed helps businesses test BI use-cases, iterate quickly, and scale gradually.
  • They tend to be tool-agnostic and flexible — able to integrate with cloud data lakes, hybrid data sources, and modern analytics stacks without enforcing a rigid infrastructure.
  • For companies needing predictive analytics, custom reports, embedded analytics, or AI-based insights without major infrastructure overhaul — such consultancies provide cost-effective BI transformation.

Best for: Startups, growth-stage companies, and mid-size enterprises looking for flexible, scalable, and affordable BI solutions without committing to heavy upfront investment.

Legacy & Global Consulting Firms – Enterprise-Scale BI

Large, global consultancies and legacy BI players remain relevant in 2025–2026 — especially for enterprises with complex data landscapes, global operations, regulated industries, and compliance needs. These firms offer broad domain expertise, rigorous data governance, and enterprise-grade BI deployments.

Advantages of legacy/global firms:

  • They bring stability, compliance support, regulatory readiness, and global delivery capabilities.
  • Their teams often include experts in data architecture, data warehousing, compliance, security, cloud migrations, and cross-region data governance.
  • They serve enterprises needing full-scale BI deployments, covering multiple business units, geographies, and compliance requirements.

Best for: Multinational corporations, regulated industries (finance, healthcare), and organizations requiring extensive governance, security, and enterprise-wide BI architecture.

How to Choose the Right Business Intelligence Service Provider for You

Selecting the “right” BI partner depends heavily on where your organization stands today — and where you want to go tomorrow. Here’s a practical checklist to help you evaluate potential partners:

  • Assess Current Data & Infrastructure Readiness
    • Do you have a data warehouse, data lake, or only spreadsheets?
    • Are your data sources scattered, structured, semi-structured, or unstructured?
    • Do you need real-time data ingestion or batch data processing?
  • Define Your BI Goals & Use Cases
    • What do you need — dashboards, reporting, real-time monitoring, predictive analytics, data governance, cloud migration, or AI/ML insights?
    • Which business functions should benefit — sales, finance, operations, HR, etc.?
  • Match Provider’s Strength to Your Needs
    • For custom, scalable, long-term BI: choose flexible, full-service providers (e.g., Andolsoft, Persistent, Stefanini).
    • For rapid deployment and cost-effectiveness: consider agile BI consultancies or smaller specialist firms.
    • For enterprise-grade governance and compliance: global/legacy firms win.
  • Check Tool & Technology Compatibility
    • Ensure providers support your preferred platforms: cloud BI (Snowflake, AWS, Azure), BI tools (Power BI, Tableau, Looker, etc.), real-time streaming (Kafka, Spark), data science & ML tools.
    • Confirm they support data governance, data security, compliance standards relevant to your industry.
  • Review Track Record & Domain Experience
    • Look for case studies, client testimonials, vertical-specific implementations.
    • Prefer providers with prior experience in your industry or similar scale & complexity.
  • Consider Cost, Timeline & Scalability
    • Balance cost vs value: cheaper providers may suit small-scale BI needs; bigger firms might deliver more robust long-term value.
    • Check how easily you can scale BI as data volume grows, or as you add new data sources.
  • Plan for Culture & Change Management
    • BI success requires more than technology — it’s about adoption, data culture, user training, consistent workflows, and management support.
    • Choose a provider who offers training, documentation, and long-term support.

Benefits of Working with the Right BI Provider

Partnering with a good Business Intelligence Service Provider can bring multiple benefits:

  • Accelerated decision-making — with real-time dashboards and consolidated data, leaders get timely insights.
  • Improved operational efficiency — BI helps highlight inefficiencies, drive process improvements, reduce costs.
  • Better forecasting and strategic planning — with historical data, predictive analytics, and trend analysis.
  • Enhanced data governance and compliance — especially useful for regulated industries.
  • Scalability — as the business grows, BI platforms and data architecture scale along, avoiding bottlenecks.
  • Data-driven culture — empowers teams across departments to make informed, data-backed decisions.

Ultimately, the ROI from a well-implemented BI solution — whether in productivity, cost-savings, or strategic advantage — often outweighs the investment many times over.

Final Thoughts

In 2025–2026, the role of data and analytics in business decision-making will only grow stronger. Companies that harness data effectively will lead markets; those that ignore it risk falling behind.

The firms above — from agile, AI-first consultancies to enterprise-scale global players — represent the best of what BI consulting has to offer today. By carefully matching your business needs, data maturity, and strategic goals with the right provider, you can build a robust, scalable, and future-ready BI foundation.

If you seek flexibility and customization, consider Andolsoft. If you manage complex enterprise data across legacy systems and cloud, firms like Mphasis, Persistent Systems, or Stefanini may be better fits. For smaller companies or quick deployments, agile consultancies and BI-specialist firms offer speed and cost-effectiveness.

Whatever your choice — remember: data without insight is just noise. The right BI provider turns noise into clarity, confusion into strategy, and data into decisions.

FAQs

Here are some frequently asked questions about choosing and working with BI providers:

1. What exactly do Business Intelligence Service Providers do?

They help collect, clean, integrate, store, analyze, and visualize data — turning raw data into actionable insights. This includes building data warehouses or lakes, ETL pipelines, dashboards, reporting systems, and analytics models.

2. Which industries benefit most from BI?

Virtually all industries — finance, retail, healthcare, manufacturing, logistics, telecom, tech, services — benefit. BI helps with operational visibility, customer analytics, forecasting, risk management, and strategic planning.

3. How long does a full BI implementation take?

It varies. A basic BI deployment with dashboards might take 1–3 months. A full-scale enterprise BI rollout — including data migration, architecture overhaul, analytics, governance — could take 4–9 months or longer, depending on complexity.

4. Does BI always require cloud infrastructure?

Not always. Some business intelligence solutions can run on-premise. However, cloud BI is increasingly popular because it offers scalability, flexibility, easier data collaboration, and lower infrastructure overhead.

5. Can BI providers help with unstructured data (e.g. documents, images)?

Yes. Leading providers increasingly support unstructured data analytics, leveraging tools like AI/ML, natural language processing (NLP), cognitive computing to extract insights from documents, images, logs, social media, etc.

6. What BI tools are commonly used?

Popular tools include Power BI, Tableau, Looker, Qlik, Sisense, Domo, along with true cloud data platforms like Snowflake, Databricks, AWS/Azure/GCP data stacks, streaming tools (Kafka/Spark), and custom ML/AI solutions.

7. What’s the difference between BI and advanced analytics/data science?

Business intelligence traditionally covers descriptive analytics — reporting, dashboards, historical trend visualization. Advanced analytics and data science add predictive, prescriptive analytics, machine-learning models, forecasting, anomaly detection, pattern recognition — going beyond “what happened” to “why it happened” and “what will happen.”

8. How do I know when my business needs BI?

If you face data overload, multiple data sources, delayed or inconsistent reporting, manual spreadsheets, lack of insight-driven decisions, or want better forecasting — it’s time to adopt BI.

9. What makes a great BI partner?

A great partner offers end-to-end services, aligns with your business goals, supports scalability, handles data governance, delivers clean and user-friendly dashboards, ensures timely support/training — and adapts as your data needs evolve.

10. Does BI adoption guarantee success?

BI is a tool — its success depends on data quality, adoption by teams, consistent governance, and using insights in decision-making. With the right strategy and partner, BI greatly increases chances of success.

BI Dashboards: Must-Have Metrics for CEOs and COOs

In today’s data-driven era, over 68% of CEOs agree that timely insights from BI dashboards directly improve organizational performance. Yet, many leaders still struggle with siloed spreadsheets, inconsistent reporting, and outdated visualizations.

Imagine having live, actionable metrics at your fingertips — guiding every strategic move, from revenue forecasting to operational efficiency.

This blog will help you understand:

  • Why BI dashboards are critical for modern leadership
  • The must-have KPIs for CEOs and COOs
  • Best practices to build dashboards that deliver value
  • Real-world success examples powered by Andolasoft

Let’s dive in.

BI Dashboards Metrics

Why BI Dashboards Matter for Executives

Fast-moving markets require leaders to operate on more than intuition — they need accurate, real-time insights. BI dashboards act as a strategic nerve center that consolidates data from ERP, CRM, IoT, and external APIs.

However, legacy systems commonly create:

Key Challenges Executives Face

Challenge Impact
Data Silos & Inconsistencies Conflicting numbers lead to poor decisions
Inefficient Reporting Cycles Manual reporting consumes days, delaying action
Security & Compliance Risks Data spread across tools increases exposure

Industry Impact Examples

  • Healthcare: Lack of dashboards results in poor visibility into patient flow and resource usage.
  • eCommerce: Reliance on delayed metrics causes missed sales and inventory risks.
  • Logistics: Without real-time tracking, fuel costs rise and delivery delays increase.
  • Fintech/SaaS: Inability to correlate churn with product usage slows growth.

The consequences? Revenue leakage, reduced efficiency, and slower innovation.

By partnering with Andolasoft, enterprises modernize reporting with scalable BI, AI, and ML-driven insights.

Best Practices for Building Executive BI Dashboards

To create dashboards that empower CEOs and COOs, follow these proven steps:

Define Clear Objectives

  • Align KPIs with strategic goals
  • Limit dashboards to 3–5 core objectives
  • Avoid “dashboard bloat”

Choose the Right Metrics

Example KPI Categories:

  • Revenue & Profitability → MRR/ARR, EBITDA, Gross Margin
  • Operational Efficiency → Cycle times, on-time delivery, resource utilization
  • Customer Experience → NPS, CSAT, churn rate
  • Employee Productivity → Utilization rate, project completion speed

Use Proven Frameworks

  • Balanced Scorecard → 360° organizational view
  • OKRs → Tie metrics to measurable outcomes

Ensure Data Quality & Governance

  • Standardized ETL/ELT pipelines
  • RBAC permissions, audit logs & encryption

Prioritize Usability & Design

  • Large KPI cards for priority metrics
  • Drill-downs and filters for deeper insights
  • Mobile-responsive layout for executives on the go

Optimize Scalability & Speed

  • Leverage Snowflake, BigQuery or Redshift
  • Use caching and incremental loads to improve performance

Adopt Agile & DevOps for BI

  • CI/CD pipelines for dashboard releases
  • Automated data validation and monitoring

Avoid Common Pitfalls

  • Limit to max 8 widgets per view
  • Don’t ignore mobile analytics use cases

Quick Wins for Faster Impact

  • Executive summary cards
  • Slack/email alerts
  • Industry-specific dashboard templates

Andolasoft’s Role in BI Transformation

With deep expertise in:

Andolasoft builds future-ready BI systems with modern architecture, security, DevOps automation, and scalable design.

Customer Success Story

A fintech startup partnered with Andolasoft to build a real-time credit risk dashboard. Results in 12 weeks:

Outcome Impact
40% Faster Reporting From 3 days to 30 minutes
30% Higher Conversion Optimized loan journey based on behavior insights
25% Cost Reduction Smart scaling eliminated cloud waste

Executives now make real-time, data-backed decisions, with predictive alerts and improved risk controls.

Key Takeaways

  • Define objectives before selecting metrics
  • Focus on core KPIs aligned with financial, operational, and customer outcomes
  • Ensure data governance and scalable cloud architecture
  • Use agile processes for continuous improvement
  • Partner with experts — BI dashboards aren’t plug-and-play

BI dashboards are no longer optional — they’re a strategic advantage.

FAQs

Q1. What are the most critical BI dashboard metrics for CEOs and COOs?

MRR/ARR, gross margin, cycle times, on-time delivery, NPS, CSAT, churn rate, and employee utilization.

Q2. How can I ensure data accuracy?

Standardize ETL/ELT pipelines, enforce RBAC, and automate validation.

Q3. Can Andolasoft integrate legacy systems?

Yes — we connect outdated systems to modern cloud warehouses with secure workflows.

Q4. Which BI tools are recommended?

Microsoft Power BI, Tableau, Qlik Sense, and Looker.

Q5. How fast can we deploy a dashboard?

A functional MVP can be ready in 4–6 weeks.

Predictive BI: Transforming Raw Data Into Future Insights

Predictive BI is reshaping how organizations anticipate market trends, customer behaviors, and operational bottlenecks.

According to a recent Gartner report, companies adopting predictive intelligence can improve decision-making speed by up to 50%.

In today’s hyper-competitive landscape, traditional reporting is no longer enough.

Leaders now require real-time forecasting to stay ahead — making Predictive BI: Transforming Raw Data Into Future Insights more urgent than ever.

In this post, you’ll learn:

  • Why predictive intelligence is mission-critical
  • Practical frameworks and implementation strategy
  • Real-world results from transformations

Whether you’re a CTO, founder, product manager, or engineering lead — you’ll walk away with a blueprint for implementing Predictive BI with confidence and measurable ROI.

Predictive BI The Future of Decision-Making

Why Predictive BI Matters Now

As organizations scale, data grows exponentially — from IoT sensors and SaaS interactions to ERP and CRM workflows. Without predictive intelligence, businesses risk inefficiencies and lost opportunities.

What Happens Without Predictive BI?

  • Overstocked inventory and lost sales due to poor forecasting
  • Reactive operations, leading to downtime and inefficiencies
  • Cybersecurity threats that go unnoticed until it’s too late

Where Predictive BI Is Making an Impact

  • Healthcare: Predict patient admissions to reduce staffing gaps
  • Logistics: Optimize routes to reduce fuel consumption by 15%
  • SaaS: Improve conversion rates by 20% using behavioral analytics
  • Manufacturing: Detect maintenance needs before equipment fails

The Cost of Doing Nothing

Legacy BI systems create:

  • Data silos
  • Manual reporting delays
  • High operational costs

Modern enterprises need a scalable, integrated Predictive BI ecosystem — guided by experts who understand both technology and industry context.

Predictive BI Framework & Best Practices

Implementing Predictive BI is not a one-time task — it’s a structured journey. Below is the recommended implementation roadmap.

1. Define Clear Business Objectives

Align predictive goals to measurable KPIs such as churn reduction, seasonal demand forecasting, or supply chain efficiency.

2. Conduct Data Inventory & Quality Assessment

Audit data sources (ERP, CRM, IoT sensors, finance systems) and evaluate them based on:

  • Completeness
  • Accuracy
  • Timeliness

High-quality input = reliable predictions.

3. Choose Scalable Architecture

Adopt Lambda or Kappa architecture to support:

  • Real-time analytics
  • Batch processing
  • Cost efficiency

4. Select the Right Tech Stack

Select the Right Tech Stack

5. Iterative Model Development

Use Agile sprints, A/B testing, and continuous retraining to maintain accuracy as data evolves.

6. Embed Security & Compliance

Implement:

  • Encryption
  • RBAC
  • Audit logs
  • SOC 2/HIPAA compliance

7. Monitor, Optimize & Operationalize

Deploy model drift alerts and automated dashboards.

Quick Wins:

  • Add anomaly alerts for trend deviations
  • Enable self-service access for end users

8. Build a Data-Driven Culture

Train teams, provide documentation, and make insights accessible.

Do’s & Don’ts of Predictive BI

Do: Invest in data governance early
Don’t: Overcomplicate early models

Do: Containerize deployments (Kubernetes, Docker)
Don’t: Ignore model explainability — stakeholder trust matters

How Andolasoft Accelerates Predictive BI Adoption

Andolasoft offers end-to-end expertise:

  • Custom Web & Mobile Engineering: Predictive dashboards and apps
  • SaaS Product Engineering: Scalable multi-tenant architecture
  • BI, AI & ML Solutions: End-to-end model pipelines
  • Application Modernization: Migration to cloud-native stacks
  • Cloud, DevOps & Automation: Predictive CI/CD and automated retraining

With Andolasoft as a technology partner, organizations avoid:

  • Data silos
  • Costly architectural missteps
  • Underutilized analytics investments

Customer Success Example

  • Challenge: Predict patient admission volumes to reduce ER wait times.
  • Solution: Real-time forecasting deployed with cloud-native predictive framework.

Results in 6 Months:

  • 40% reduction in ER wait times
  • 25% improvement in staffing efficiency
  • 30% infrastructure savings through modernization

MedSecure now scales confidently with predictive capabilities embedded across operations.

Key Takeaways

  • Predictive BI converts raw data into forward-looking insights that drive measurable business impact.
  • High-quality data, scalable architecture, and governance are foundational.
  • Continuous model training and DevOps practices ensure accurate forecasting.
  • Security, compliance, and explainability must be included from day one.
  • Working with Andolasoft accelerates deployment and avoids implementation pitfalls.

When Dashboards Started Thinking: The Journey of Superset and AI

Once upon a time, data was scattered. Teams worked in isolation, reports came late, and dashboards, though detailed, offered only a glimpse of the past. Numbers were there, but clarity was not. Insight was rare. And foresight? Almost impossible.

Then, everything changed.

The Turning Point: From Static to Smart

It started with a realization:

Traditional BI tools showed what happened, but not why. Not what’s next.

That gap led to a powerful new combination:

  • Superset—a flexible, open-source data visualization platform that democratizes data access.
  • Artificial Intelligence (AI)—A game-changer in predictive analytics, pattern recognition, and data storytelling.

Together, they turned dashboards from static charts into intelligent decision-making systems.

Superset: The Canvas for Data Stories

Superset brought visual simplicity and data exploration together:

  • Clean, intuitive interface
  • Connects to popular databases (PostgreSQL, MySQL, BigQuery, Snowflake, etc.)
  • Custom SQL-based reporting and no-code filtering
  • Drag-and-drop dashboards and a wide chart library
  • Real-time data interaction

Whether for a quick KPI snapshot or a deep-dive analysis, Superset became the go-to canvas for visual narratives.
But numbers alone don’t tell the full story. Meaning and intelligence were still missing.

AI: The Brain Behind the Dashboard

AI stepped in to fill that gap, turning data into actionable insights:

  • Trend Detection: Surfaced subtle shifts in data patterns
  • Anomaly Alerts: Spotted unusual activities instantly (e.g., revenue drops, login spikes)
  • Forecasting Models: Predicted future outcomes based on historical trends
  • Natural Language Queries (NLP): Users could ask, “Show Q2 revenue breakdown by product,” and get instant visual answers
  • Proactive Notifications: Triggered alerts when KPIs deviated from the norm

Now, dashboards don’t just show data.

They understood it, reacted to it, and anticipated what’s next.

A New Way to See and Decide

The result? Business intelligence shifted from being data-centered to decision-centered.

  • Teams made faster decisions with contextual insights
  • No more delays or backlogs in reporting requests
  • Data exploration became interactive and ongoing
  • Non-technical users could extract powerful insights without writing a line of SQL

Data was no longer a department—it became a capability across the organization.

Where This Works Best

Where This Works Best

Benefits at a Glance

Benefits at a Glance

From Reactive to Proactive

This isn’t just about having prettier charts. It’s about

  • Moving from reporting to predicting
  • Turning raw data into automated decision support
  • Freeing up analyst time with self-serve insights

Superset and AI don’t just visualize the past.

They help you act on the future.

Ready to Transform the Way You Use Data?

If you’re ready to

  • Stop reacting to reports and start forecasting outcomes
  • Equip every team with smart, real-time dashboards
  • Replace isolated data teams with collaborative insight cultures

Then this is the moment to embrace Superset + AI.

Start your journey to smarter analytics today.