Top 15 Benefits of Implementing a Self-Service BI Platform

Today, leaders across industries face a common challenge: business decisions must be faster, more data-driven, and more accurate than ever before. Yet most organizations still struggle with slow reporting cycles, fragmented data sources, and overloaded IT teams. This is where a Self-Service BI Platform creates real competitive advantage.

By empowering teams to independently access, analyze, and visualize data, businesses unlock agility, reduce bottlenecks, and drive high-velocity execution. Moreover, organizations embracing self-service analytics report 30–50% faster decision-making, according to several global BI studies.

In this blog, you’ll discover the top 15 benefits of implementing a Self-Service BI Platform, why it matters in today’s digital era, and how companies can adopt it effectively. You’ll also see how Andolasoft, with its proven expertise in BI, AI, machine learning, SaaS engineering, data analytics, and enterprise solutions, helps global brands transform their data capabilities.

Top 15 Benefits of a Self-Service BI Platform

Why Modern Businesses Need a Self-Service BI Platform

In most organizations, analytics has long been an IT-driven process. Departments rely on data teams to prepare reports, extract datasets, or build dashboards. This creates delays, limits innovation, and slows decision-making.

A Self-Service BI Platform resolves these gaps by democratizing access to insights. It enables business users — sales managers, finance teams, marketers, operations leaders, and product managers — to explore data on their own without technical dependencies.

Why It Matters Today

Modern industries — from healthcare and manufacturing to fintech and eCommerce — operate in fast-moving environments. Data volumes continue to explode, yet delayed insights cause missed opportunities. A Self-Service BI Platform resolves these challenges by:

  • Reducing the decision-making cycle from days to minutes by enabling users to generate reports on demand.
  • Aligning teams on real-time data rather than outdated spreadsheets or manual data pulls.
  • Cutting operational inefficiencies caused by poor data visibility or inconsistent reporting practices.
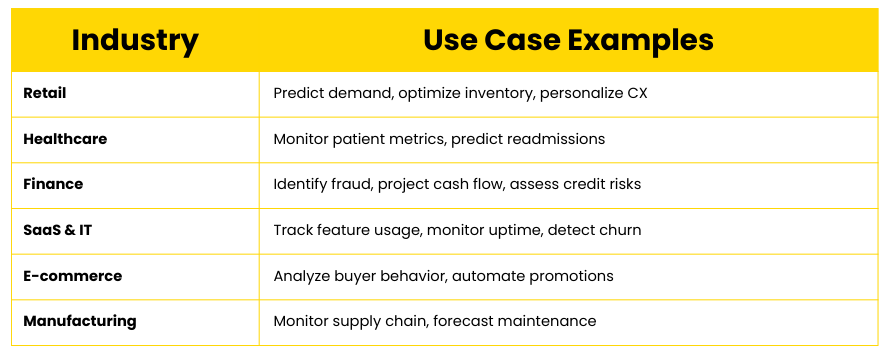
Industry Use Cases

A Self-Service BI Platform delivers measurable impact across sectors:

  • Healthcare: clinicians access real-time patient metrics, improving care delivery and operational planning.
  • Ecommerce: marketing and product teams monitor campaign performance, purchase behavior, and funnel drop-offs instantly.
  • Manufacturing: plant managers analyze downtime, production defects, and supply chain trends without waiting for IT support.
  • Fintech: regulatory, fraud, and transaction dashboards become self-operational, reducing compliance risks.
  • SaaS: product teams iterate faster using usage analytics, churn insights, and cohort reports.

Risks of Not Adopting Self-Service Analytics

Organizations that do not modernize continue to struggle with:

  • Long reporting delays that slow strategic decisions.
  • High dependency on IT, delaying innovation.
  • Data silos leading to inconsistent insights across teams.
  • Security vulnerabilities due to manual exports and spreadsheet sharing.
  • Revenue loss from inaccurate forecasting or delayed insights.

In a digital-first world, a Self-Service BI Platform is not a luxury—it is a foundational operational capability that enables enterprises to scale efficiently and securely.

Top 15 Benefits of Implementing a Self-Service BI Platform

Below are the most impactful advantages organizations gain when adopting a modern, enterprise-grade Self-Service BI Platform.

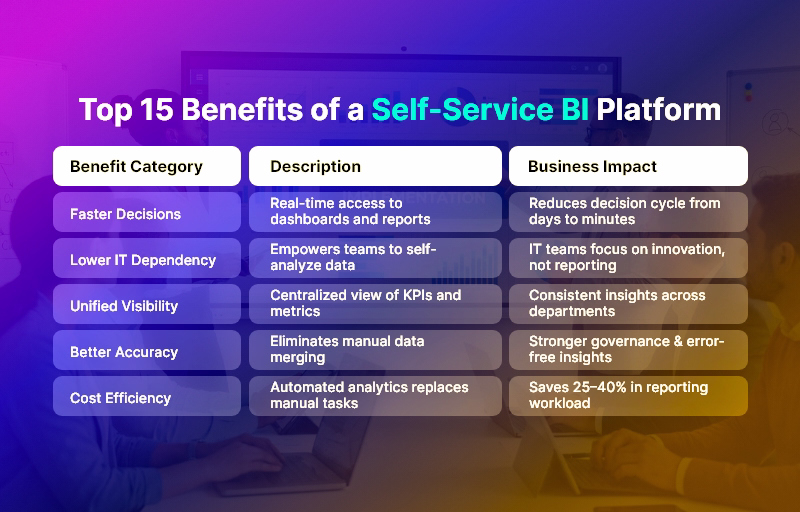
1. Faster Decision-Making Across Departments

A Self-Service BI Platform eliminates dependencies on IT teams, enabling business users to generate insights instantly. This results in significantly shorter decision cycles, faster approvals, and quicker execution across sales, finance, supply chain, and operations.

2. Reduced IT Workload & Operational Bottlenecks

IT teams often spend 40–60% of their workload on routine reporting tasks. By shifting routine analytics to end-users, a Self-Service BI Platform frees technical teams to focus on strategic initiatives like automation, modernization, or AI implementation.

3. Unified Data Visibility Across the Organization

Self-service BI brings every department onto a centralized data platform, ensuring everyone works with the same numbers. This promotes alignment, reduces conflicts, and eliminates discrepancies in decision-making.

4. Improved Data Accuracy & Governance

With automated pipelines, role-based access, and standardized dashboards, organizations greatly reduce errors caused by spreadsheets, manual consolidation, and outdated reports.

5. Empowered Business Users and Greater Ownership

Teams that can explore their own data develop deeper analytical thinking and take more ownership of KPIs. This creates a performance-driven culture where insights drive action.

6. Real-Time Reporting and Live Dashboards

Traditional BI usually relies on static reports. A Self-Service BI Platform enables dynamic dashboards that refresh automatically, ensuring real-time visibility into KPIs, customer behavior, and operational metrics.

7. Enhanced Collaboration Between Technical and Business Teams

With self-service analytics, business teams independently generate insights while IT teams focus on data quality, security, and architecture. This leads to stronger collaboration and better alignment.

8. Lower Operational Costs

By automating reporting workflows and reducing manual effort, organizations often reduce analytics costs by 25–40%. The Self-Service BI Platform becomes an engine for efficiency and resource optimization.

9. Discovery of New Insights & Opportunities

Self-service exploration encourages curiosity and experimentation. Teams uncover patterns, root causes, and opportunities that would otherwise remain hidden in data silos.

10. Scalability for Growing Teams & Data Volumes

Self-service BI tools are built for scale. As new departments, markets, or product lines are added, the platform can easily expand without architectural bottlenecks.

11. Stronger Data Security Through Centralized Access Controls

A Self-Service BI Platform reduces risk by eliminating unsecured spreadsheets and enabling enterprise-grade permissions, encryption, and audit trails.

12. Automation of Repetitive Analytics Tasks

Scheduled reports, automated alerts, and prebuilt dashboards minimize manual effort. Teams always have updated insights without repetitive data pulls.

13. Better Customer Experience Through Faster Insights

Modern businesses rely heavily on customer analytics. Self-service BI enables rapid insight into churn, retention, behavior, and personalization opportunities.

14. Improved Forecasting and Strategic Planning

With real-time access to historical and current data, leadership teams produce more accurate forecasts, financial models, and growth strategies.

15. Higher Organizational Agility and Competitive Advantage

Ultimately, a Self-Service BI Platform enables companies to react faster, innovate more confidently, and stay ahead of competition by making decisions powered by real-time intelligence.

Best Practices for Implementing a Self-Service BI Platform

Success with self-service analytics requires thoughtful strategy, process alignment, and the right technology foundation. Below are actionable best practices and frameworks.

1. Establish Clear Data Ownership

Define who manages data quality, governance, and access. Clear roles prevent duplication, data drift, or inconsistent definitions.

2. Build a Centralized Data Architecture

Consolidate sources into a unified data warehouse or lakehouse. This ensures reliability, consistency, and scalability for high-volume analytics.

3. Choose a Flexible, Scalable BI Toolset

Evaluate tools based on visualization capabilities, governance, performance, security, and integration ease.

4. Implement Role-Based Access Controls

Ensure users only access relevant datasets. This protects sensitive information while enabling broad adoption.

5. Standardize Dashboards & Metrics

Create a universal KPI library so every team uses the same definitions for revenue, churn, conversion, utilization, and performance.

6. Enable Training & Upskilling for Non-Technical Teams

Provide training programs on data literacy, dashboard building, and analytics best practices.

7. Use Automation Wherever Possible

Automate ETL pipelines, alerts, data quality checks, and scheduled reporting.

8. Monitor Usage & Continuously Improve

Review dashboard adoption, usage statistics, load times, and user feedback to refine BI strategy.

How Andolasoft Helps Companies Build a Powerful Self-Service BI Platform

Andolasoft provides end-to-end BI and analytics expertise across:

We design scalable, secure, and intuitive BI environments that empower business users while maintaining enterprise governance.

Case Study

For example, a mid-sized transportation provider, partnered with Andolasoft to build a BI Platform that unified data from fleet systems, driver apps, billing tools, and telematics. Within 10 weeks, the company achieved:

  • 40% faster operational decisions due to real-time dashboards.
  • 30% reduction in manual reporting efforts, freeing teams for revenue-generating activities.
  • Enhanced route optimization, reducing fuel costs by nearly 18%.

Here’s what changed: managers gained instant access to KPIs, predictive insights improved planning, and operational bottlenecks reduced significantly.

Key Takeaways

A Self-Service BI Platform is no longer optional—it is essential for modern, data-driven enterprises. The most important insights include:

  • It accelerates decision-making and reduces IT dependency.
  • It creates real-time, unified visibility across the organization.
  • It boosts efficiency, accuracy, governance, and competitive advantage.
  • It empowers teams to innovate, experiment, and take ownership of outcomes.

Organizations implementing a Self-Service BI Platform today position themselves for long-term scalability, efficiency, and digital transformation.

FAQs

1. What is a Self-Service BI Platform?

It is a modern analytics system that enables non-technical users to access, explore, and visualize data independently, without relying on IT teams.

2. Why do businesses need a Self-Service BI Platform?

It improves decision-making speed, reduces bottlenecks, eliminates data silos, and empowers teams to work with accurate data in real time.

3. Is a the BI Platform secure?

Yes. These platforms use role-based permissions, audit trails, encryption, and centralized governance to ensure data protection.

4. How long does implementation typically take?

Depending on the complexity, implementation can take 4–12 weeks with proper planning, architecture setup, and user onboarding.

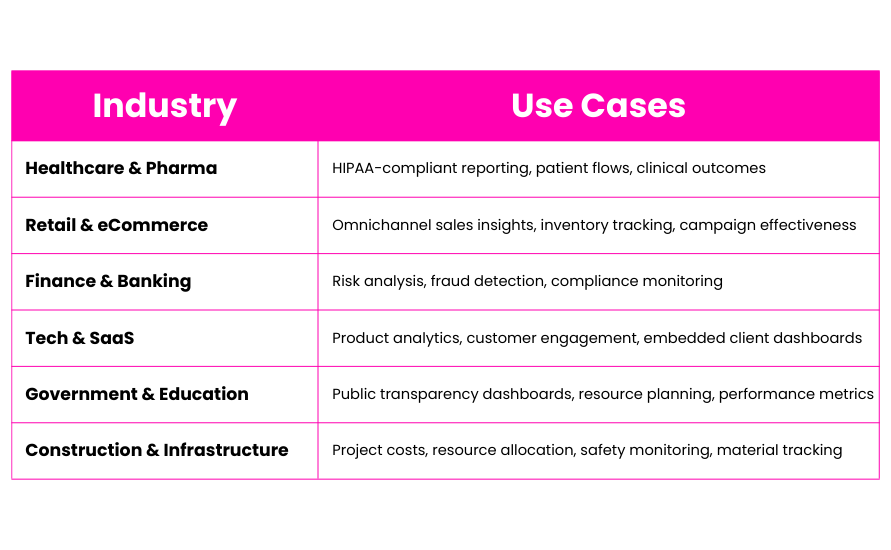
5. What industries benefit most from a BI Platform?

Healthcare, eCommerce, fintech, manufacturing, logistics, SaaS, retail, and education all gain substantial advantages from real-time analytics.

6. Does Andolasoft build custom BI solutions?

Absolutely. Andolasoft specializes in end-to-end BI engineering, AI-driven analytics, ML models, SaaS development, and enterprise-grade data platforms.

7. Can a Self-Service BI Platform integrate with existing systems?

Yes, modern BI tools integrate seamlessly with CRMs, ERPs, SaaS apps, databases, cloud systems, and third-party APIs.

Top 10 Power BI Alternatives with Better Customization

BIIn an era when the demand for data-driven decision-making is skyrocketing, businesses are increasingly seeking more flexible and customizable analytics platforms than traditional tools. According to market data, the global business intelligence market is projected to nearly double from ~ $34.8 billion in 2025 to over $63 billion by 2032, as companies across industries ramp up investments in data and analytics. For many organizations, however, Microsoft Power BI — while popular — can feel limiting in terms of deep customization, embedded analytics, or integration flexibility. That is why exploring Power BI alternatives has become a critical step for CTOs, product managers, and business leaders.

In this blog, you’ll discover the top 10 Power BI alternatives that deliver superior customization, scalability, and control. Moreover, you’ll learn how a seasoned development partner like Andolasoft can help integrate and extend these tools to build truly tailored BI/analytics solutions for your enterprise needs.

Top 5 Customization in BI Solutions

Why Customizable BI Tools Matter for Growing Businesses

Business intelligence (BI) is no longer a “nice-to-have” — it’s a strategic imperative. As defined by industry experts, BI encompasses the processes and platforms organizations use to collect, analyze, and interpret data to inform decisions.

For growing businesses — whether in healthcare, logistics, eCommerce, education, fintech, or manufacturing — the benefits of BI are tangible: improved operational efficiency, better forecasting, data-driven decision-making, and competitive advantage.

Challenges with Traditional or Out-of-the-Box BI Solutions

  • Many organizations still suffer from low BI maturity: according to a report, over 87% of companies fall into “basic” or “opportunistic” BI maturity levels — relying heavily on spreadsheets or siloed data efforts.
  • Off-the-shelf BI tools may lack the flexibility or extensibility required to adapt to unique business logic, complex workflows, or custom integrations — especially in industries with specialized needs (e.g. multi-warehouse supply chain analytics, real-time IoT data from manufacturing, or compliance-heavy fintech).
  • Without strategic BI implementation, companies risk inefficiencies, poor data governance, security vulnerabilities, and lost revenue opportunities due to underutilized data.

Hence, modern enterprises need customizable, scalable, and secure BI platforms — not patchwork solutions or “quick fix” dashboards.

That’s where exploring Power BI alternatives makes sense — and why partnering with a full-stack development and BI services provider like Andolasoft becomes strategic.

What Makes a Good Alternative? Key Criteria & Best Practices

Before diving into specific tools, it’s useful to understand the criteria and best practices that define a successful BI platform — especially one that seeks to go beyond Power BI’s standard capabilities.

Essential Capabilities to Look For

  • Customizable analytics & dashboards: The ability to build deeply customized reports, dashboards, and visualizations tailored to your domain and metrics.
  • Self-service BI for business users: Non-technical users should be able to explore data, build ad hoc reports, and access insights without deep coding or IT dependence.
  • Scalable, modern architecture: Cloud-native or hybrid platforms that scale with data volume, user load, and complex workflows, with robust governance and security.
  • Integration and flexibility: Ability to integrate with existing data warehouses, data lakes, ETL tools, third-party services, APIs, and custom applications.
  • Embedded & composable analytics: Options to embed BI/analytics within your own web or mobile applications — giving you full control over UI/UX, workflow, permissions, and branding.

Best Practices & Implementation Tips

  • Define your data & analytics strategy first. Establish goals, KPIs, data sources, governance, and ownership before selecting tools — so the BI platform helps solve concrete problems, not just add dashboards.
  • Adopt a modular architecture (data warehouse → analytics engine → presentation layer). This ensures flexibility and future-proofing as data volume and complexity grow.
  • Enable self-service while maintaining governance. Balance user autonomy with data quality, security, and consistent data definitions across the organization.
  • Iterate dashboards & data models over time. Don’t treat BI as a one-time project. Evolve dashboards based on user feedback, changing business requirements, and data volume growth. (Recent research shows that dashboards become more useful when continuously refined.)
  • Use automation, DevOps, and CI/CD for BI pipelines. Treat data pipelines, ETL jobs, models, and dashboard deployments as first-class software — so updates, scaling, and maintenance are systematic and manageable.
  • Ensure scalability and security from day one. As data grows, make sure performance, access control, and compliance remain robust.

Because of these requirements, many businesses find that integrating or customizing a BI tool — rather than using default configurations — yields far higher value. That’s exactly where a partner like Andolasoft brings value, combining expertise in BI, data analytics, SaaS engineering, DevOps, cloud infrastructure, and custom application development.

Top 10 Power BI Alternatives with Better Customization

Here are ten BI tools and platforms that often outshine Power BI when it comes to customization, flexibility, and integration potential. Each of these can be tailored — or embedded — to align with your unique business requirements.

Fully Custom-Built BI Solution by Andolasoft

Sometimes, no standard BI tool fits unique workflows — especially in domains like:

  • Fintech (compliance-heavy custom dashboards)
  • Multi-warehouse logistics (real-time IoT + GIS data)
  • Healthcare (HIPAA-compliant insights)
  • EdTech (student lifecycle analytics)

A full-custom BI solution provides:

  • Controlled data pipelines + governance
  • Tailored dashboards matching exact roles + KPIs
  • Data models specific to business workflows
  • Embedded analytics inside core products
  • Own the full IP + no vendor lock-in

Andolasoft builds these using:

  • Data warehouses (Snowflake, BigQuery, Redshift, etc.)
  • Custom visual layers (React, Angular, mobile apps)
  • Secure pipelines (Airflow, dbt, serverless ETL)
  • AI/ML insights on top of structured metrics

Best suited for:

  • Product-led companies wanting complete control
  • High-growth enterprises needing future-proof scalability
  • Industry-specific use cases NOT supported by generic BI

Google Cloud Looker

Looker is a modern BI platform built around LookML, a semantic modeling layer that ensures consistent business metrics across dashboards, teams, and applications.

It offers extreme flexibility for embedding analytics into web or mobile products — with fully customizable UI/UX and brand-level control. Because Looker queries data in place (no extracts needed), it works seamlessly with any cloud data warehouse.

Best suited for:

  • SaaS products wanting embedded analytics
  • Enterprises needing governed, centralized metrics
  • Organizations working with multi-cloud data architectures

Key customization strengths:

  • Custom modeling with LookML
  • API-first platform for building tailored analytics experiences
  • Pixel-perfect control over front-end analytics

Qlik Cloud Analytics®

This BI solution stands out with its Associative Engine, enabling users to explore all possible relationships in data — not just predefined queries.

Qlik Cloud Analytics® offers high customization through extensions, custom visual scripting, and developer-friendly SDKs.

Best suited for:

  • Businesses with complex multi-source data
  • Data-intensive manufacturing, logistics, retail analytics
  • Teams needing exploratory analytics over rigid reporting

Key customization strengths:

  • Fully extensible dashboards with custom visualizations
  • In-memory engine for real-time exploration
  • Enterprise-grade architecture + advanced governance

ThoughtSpot Agentic Analytics Platform

ThoughtSpot uses AI and natural language search to generate insights — no SQL required. Its core superpower is search-driven analytics, making it incredibly self-service friendly. Developers can embed AI-powered analytics into other systems via APIs.

Best suited for:

  • Leaders who want insights instantly without analyst dependency
  • Data democratization initiatives
  • Sales, CX, operations teams requiring quick answers

Key customization strengths:

  • AI/ML insight recommendations
  • Conversational analytics + spotIQ automation
  • Embedded analytics and fully custom data workflows

Pricing:

  • Essentials (for small teams) – $25 per user/per month
  • Pro (for growing businesses) – $50 per user/per month
  • Enterprise (for large enterprises) – Custom pricing

GoodData

GoodData was designed specifically for composable and embedded analytics, enabling companies to create custom multi-tenant BI products.

It provides headless BI, meaning you can completely control the front-end experience through APIs.

Best suited for:

  • SaaS companies adding analytics into their product
  • Organizations requiring strict governance across different user groups
  • Data products with white-label branding

Key customization strengths:

  • Custom frontend development with React components
  • Fine-grained permissions for customer-facing analytics
  • Flexible data pipelines and governed metrics layer

Sisense

The app allows developers to embed analytics anywhere — portals, dashboards, web products, and even within app workflows.

Sisense Fusion lets you create data apps and tailor analytics experiences to specific business workflows.

Best suited for:

  • Enterprise analytics inside operational systems
  • Complex custom workflows + automation needs
  • Flexible, branded analytics in SaaS

Key customization strengths:

  • White-label dashboards
  • Highly customizable via scripts + API
  • Handles large, complex data models efficiently

Tableau

Tableau is the leader in advanced visualization design with deep customization options.

Developers can extend visual capabilities with JavaScript APIs, plugins, and Tableau Extensions for embedded use cases.

Best suited for:

  • Industries demanding visual analytics and storytelling
  • Enterprises scaling self-service dashboards
  • Teams transitioning from spreadsheets to BI

Key customization strengths:

  • Custom extensions + visual development
  • Full branding control for embedding
  • Massive library of visuals for almost any model

Pricing

  • Tableau Standard – $75 user/month
  • Tableau Enterprise – $115 user/month
  • Tableau + Bundle – Contact Sales

Mode Analytics

Mode unifies SQL + Python + R for analysts and data scientists — perfect for advanced modeling and statistical analytics.

It provides customizable reporting environments, allowing data teams to build powerful models and present insights interactively.

Best suited for:

  • Companies with strong data science / analytics teams
  • Growth-stage SaaS building tailored internal analytics
  • Experiment-heavy product teams

Key customization strengths:

  • Built-in notebooks for advanced ML analytics
  • Deep control over query models + custom visuals
  • Tailored embedded analytics for data-savvy products

Metabase

Metabase is an open-source, self-hosted BI tool — highly cost-efficient with full control over your deployment.

It’s simple for non-technical users yet customizable by engineering teams.

Best suited for:

  • SMEs avoiding licensing lock-in
  • Startups needing fast, low-cost BI
  • Data-sensitive industries that prefer on-premise

Key customization strengths:

  • Complete control over hosting + data
  • Custom dashboards with branding + embedding
  • Developer API for workflow integration

Pricing

  • Open source – Free
  • Starter – $100/month + $6/month per user
  • Pro – $575/month + $12/month per user
  • Enterprise – Custom pricing

Redash (Open Source)

Redash is a lightweight, SQL-first BI and dashboarding tool. Perfect for technical teams who want complete customization without heavy enterprise overhead.

Best suited for:

  • Advanced SQL/engineering-led analytics teams
  • Internal dashboards for operations, engineering, DevOps
  • API + CLI driven BI environments

Key customization strengths:

  • Full source code access = unlimited customization
  • Ideal for embedding minimal dashboards
  • Cost-efficient + developer-friendly

Important insight: There’s no “one-size-fits-all” BI tool — the best Power BI alternative depends on your business model, data architecture, user base, and long-term goals.

How to Evaluate & Implement an Alternative: Best Practices & Actionable Tips

Here’s a framework — built upon years of industry practice — that we at Andolasoft recommend when evaluating or implementing a BI alternative.

1. Define Business Goals & Data Strategy First

  • Clarify what you aim to achieve: improved reporting turnaround, real-time dashboards, embedded analytics in product, or self-service analytics for business users.
  • Map out your data sources (databases, data lakes, third-party services, APIs, IoT, logs, etc.).
  • Define KPIs, metrics, data governance, access controls, and which teams/users need what access.

This ensures that whichever BI platform you choose — or build — aligns precisely with business needs.

2. Prioritize Customization & Embeddability

  • If you need dashboards within your product — for SaaS or internal tools — prefer BI platforms that support embedded analytics or SDKs (e.g. Looker, GoodData, Sisense, Mode).
  • Keep the semantic layer or data model separate from the presentation layer. This avoids breaking dashboards when underlying data changes.

3. Adopt Modular, Scalable Data Architecture

  • Use a modern data stack: data warehouse / data lake (e.g. cloud-based), ETL/ELT pipelines, and analytical layer.
  • Apply DevOps / CI-CD practices to BI pipelines: treat data models, queries, dashboards as code — versioned, tested, and maintained like software.
  • Build with scalability & security in mind: scale as data grows, and enforce role-based access and data governance.

4. Empower Business Users & Maintain Governance

  • Enable self-service BI for non-technical users — so analysts, marketing, sales teams can run their own reports without IT bottlenecks.
  • But also enforce data governance, consistent definitions, and a central data model to avoid data silos or conflicting metrics.

5. Iterate, Gather Feedback, Evolve Dashboards

  • Treat BI as a living product, not a one-time deliverable. Collect feedback from end-users frequently.
  • Improve dashboards over time: refine visualizations, adjust metrics, add new data sources. This approach leads to more meaningful insights and better user adoption.

6. Leverage a Skilled Engineering Partner (When Needed)

Implementing or customizing BI — especially embedding dashboards, integrating data pipelines, ensuring security, and scaling — often requires full-stack engineering, DevOps, cloud architecture, and data expertise.

Here’s why working with a partner like Andolasoft really helps:

  • We offer Custom Web / Mobile App Development — integrating BI dashboards directly into enterprise or customer-facing products.
  • We bring BI, AI & Machine Learning Solutions — enabling advanced analytics, predictive modelling, and data-driven automation.
  • We deliver SaaS Product Engineering — ideal if you are building a SaaS product with embedded analytics.
  • We handle DevOps, Cloud & Automation — setting up scalable data pipelines, data warehouses, and secure infrastructure.
  • We manage Application Modernization & Enterprise IT Services — especially helpful when migrating from legacy BI systems or spreadsheets.

With this breadth, Andolasoft stands as a trusted technology partner to help you implement a BI solution that is not just functional — but tailored, scalable, and future-ready.

Customer Success

For example, a growing logistics company, partnered with Andolasoft to build an embedded analytics dashboard — using a combination of a cloud data warehouse, custom ETL pipelines, and a flexible BI tool. Within 4 months, they replaced multiple spreadsheets and legacy reporting tools with a unified, real-time analytics portal. As a result:

  • Reporting time reduced by 85%, from hours/days to real-time dashboards
  • Manual mistakes were eliminated — improving data accuracy and decision confidence
  • Operations management gained real-time visibility into fleet utilization, delivery times, and route performance — leading to 10% cost savings and 20% faster decision cycles

Here’s what changed: the company equipped its leadership and operations teams with actionable insights — enabling data-driven decisions, dynamic route planning, and quicker responses to changing demand.

Because Andolasoft built the solution end-to-end (data pipelines + BI + embedded dashboards), now has a scalable, maintainable analytics backbone that grows as the business expands.

Key Takeaways

  • Power BI alternatives can offer far greater customization, flexibility, and control — especially when you need embedded analytics, complex data modeling, or custom integrations.
  • A one-size-fits-all BI platform rarely fits all: the right solution depends on your business model, data strategy, and long-term goals.
    Implementing a modern BI system requires strong data architecture, governance, iterative development, and scalability — not just dropping in a tool.
  • Partnering with experts like Andolasoft — who combine BI, data, cloud, and full-stack development — ensures you build a robust, future-ready analytics solution.
  • The time to modernize your BI stack is now: as data volume and complexity grow, businesses that act early gain competitive advantage, operational efficiency and strategic agility.

By choosing one of these top Power BI alternatives — and by building thoughtfully — you unlock the power of data to drive growth, innovation, and impact.

Frequently Asked Questions

  • What makes “Power BI alternatives” necessary when Power BI is widely used?

While Power BI is popular and capable, many businesses need deeper customization, embedding, or data integration flexibility. Power BI alternatives often offer better control over the data model, custom UI/UX, or embedding capabilities — especially suitable for SaaS products, enterprise apps, and complex workflows.

  • Which Power BI alternative is best for embedding analytics in a SaaS product?

Platforms like Looker, GoodData, and Sisense stand out — because they support embedded analytics, composable architecture, and custom UI. They enable you to integrate dashboards directly into your SaaS application with custom branding and controlled user access.

  • Can small or mid-sized companies benefit from Power BI alternatives?

Absolutely. Lightweight or open-source tools such as Metabase, Redash, or Mode Analytics offer affordable, flexible, and self-hosted options. They are ideal for companies wanting to avoid vendor lock-in or requiring full control of data infrastructure.

  • Is it possible to migrate from Power BI to another BI platform?

Yes — with a clear data strategy and planning. Migration typically involves exporting data models, rebuilding dashboards, setting up ETL/data pipelines, and reconfiguring permissions. Engaging a partner experienced in data migration and BI integration (like Andolasoft) can make the transition smooth and efficient.

  • What are common mistakes companies make when implementing a new BI platform?

Some common mistakes include: skipping data governance and data strategy planning; treating BI as a one-time project (rather than ongoing); neglecting scalability, security, and performance requirements; underestimating the need for DevOps in data pipelines; and not involving end-users in dashboard design, resulting in poor adoption.

  • How can Andolasoft help with implementing a customized BI solution?

Andolasoft offers end-to-end services — from data architecture, ETL pipelines, data warehouses, to analytics, embedded dashboards, and DevOps. We help you build scalable, secure, tailored BI solutions that align with your business goals and adapt as you grow.

When Dashboards Started Thinking: The Journey of Superset and AI

Once upon a time, data was scattered. Teams worked in isolation, reports came late, and dashboards, though detailed, offered only a glimpse of the past. Numbers were there, but clarity was not. Insight was rare. And foresight? Almost impossible.

Then, everything changed.

The Turning Point: From Static to Smart

It started with a realization:

Traditional BI tools showed what happened, but not why. Not what’s next.

That gap led to a powerful new combination:

  • Superset—a flexible, open-source data visualization platform that democratizes data access.
  • Artificial Intelligence (AI)—A game-changer in predictive analytics, pattern recognition, and data storytelling.

Together, they turned dashboards from static charts into intelligent decision-making systems.

Superset: The Canvas for Data Stories

Superset brought visual simplicity and data exploration together:

  • Clean, intuitive interface
  • Connects to popular databases (PostgreSQL, MySQL, BigQuery, Snowflake, etc.)
  • Custom SQL-based reporting and no-code filtering
  • Drag-and-drop dashboards and a wide chart library
  • Real-time data interaction

Whether for a quick KPI snapshot or a deep-dive analysis, Superset became the go-to canvas for visual narratives.
But numbers alone don’t tell the full story. Meaning and intelligence were still missing.

AI: The Brain Behind the Dashboard

AI stepped in to fill that gap, turning data into actionable insights:

  • Trend Detection: Surfaced subtle shifts in data patterns
  • Anomaly Alerts: Spotted unusual activities instantly (e.g., revenue drops, login spikes)
  • Forecasting Models: Predicted future outcomes based on historical trends
  • Natural Language Queries (NLP): Users could ask, “Show Q2 revenue breakdown by product,” and get instant visual answers
  • Proactive Notifications: Triggered alerts when KPIs deviated from the norm

Now, dashboards don’t just show data.

They understood it, reacted to it, and anticipated what’s next.

A New Way to See and Decide

The result? Business intelligence shifted from being data-centered to decision-centered.

  • Teams made faster decisions with contextual insights
  • No more delays or backlogs in reporting requests
  • Data exploration became interactive and ongoing
  • Non-technical users could extract powerful insights without writing a line of SQL

Data was no longer a department—it became a capability across the organization.

Where This Works Best

Where This Works Best

Benefits at a Glance

Benefits at a Glance

From Reactive to Proactive

This isn’t just about having prettier charts. It’s about

  • Moving from reporting to predicting
  • Turning raw data into automated decision support
  • Freeing up analyst time with self-serve insights

Superset and AI don’t just visualize the past.

They help you act on the future.

Ready to Transform the Way You Use Data?

If you’re ready to

  • Stop reacting to reports and start forecasting outcomes
  • Equip every team with smart, real-time dashboards
  • Replace isolated data teams with collaborative insight cultures

Then this is the moment to embrace Superset + AI.

Start your journey to smarter analytics today.

How to Leverage Superset for Scalable and Customizable Data Analytics

In today’s digital world, data isn’t just valuable—it’s essential. But having data is only half the battle. The real advantage comes from being able to understand it, visualize it, and act on it quickly.

That’s where Apache Superset steps in.

At Andolasoft, we help businesses unlock the full potential of Superset through our enterprise-grade Superset BI Services. Whether you’re a startup or a large organization, Superset makes it easier to scale your analytics and tailor insights to your exact needs, without the high costs of traditional BI tools.

Here’s how you can make the most of Superset to drive smarter decisions.

Why Superset?

Apache Superset is a modern, open-source platform that helps you explore data, build dashboards, and uncover insights without needing to write complex code. It’s lightweight, fast, and incredibly powerful.

And the best part? It’s free to use with no licensing fees.

Let’s dive into how you can use Superset to power your data strategy.

Say Goodbye to Expensive Licensing

Superset is completely open-source, which means you don’t pay hefty subscription fees like you would with other BI platforms. You maintain full control of your data and infrastructure—no vendor lock-in.

At Andolasoft, we offer full support and customization without any restrictions, so you can focus on what matters: making better business decisions.

Jumpstart Analytics with 200+ Ready Dashboards

Why start from scratch?

We provide over 200 pre-built dashboards covering core business areas like sales, marketing, finance, HR, and operations. These dashboards help your teams track key metrics instantly—no waiting, no guesswork.

You can use them as-is or customize them to fit your specific goals.

Real-Time Reporting for Real-Time Decisions

Forget about outdated reports and delayed updates.

With Superset, your dashboards refresh automatically with live data. This means you can monitor performance in real time and take action as soon as something changes—whether it’s a drop in sales, a spike in website traffic, or an operational bottleneck.

Faster insights lead to faster decisions.

Connect All Your Tools in One Place

Superset connects to over 60 different data sources. From databases and spreadsheets to CRMs and cloud apps, you can bring all your data together for a unified view.

Some popular integrations include

  • Salesforce, Zoho CRM, and HubSpot
  • Google Ads, Facebook Ads, and Mailchimp
  • QuickBooks, Xero, and Stripe
  • MySQL, PostgreSQL, Oracle, and more

This seamless integration makes it easier to see the full picture of your business.

Embed Dashboards Wherever You Need

Superset makes it easy to embed dashboards directly into your existing tools—whether it’s your internal portal, a customer app, or a SaaS product.

This means

  • Your team can access insights without switching platforms
  • Clients can view personalized data securely
  • Everyone stays informed, right within their workflow

Powerful Visualizations That Tell a Story

Superset offers a wide range of visual tools to make your data easier to understand. Whether you’re looking at customer journeys, performance trends, or geographic insights, there’s a visualization for it.

Some popular chart types include

  • Heatmaps
  • Treemaps
  • Funnels
  • Sankey diagrams
  • Time series and geo maps

These visuals help turn complex numbers into clear, meaningful insights.

Built to Scale with Enterprise Security

Superset is designed to grow with your business.

Our Superset BI Services include:

  • Secure login options like SSO and OAuth2
  • Role-based access controls for teams
  • Support for Docker and Kubernetes for large deployments
  • Compliance-ready features for HIPAA, GDPR, and more

You get a robust, secure BI setup that scales with your needs.

Where Superset Makes an Impact

Superset BI Services work across a variety of industries:

  • Healthcare: Track patient outcomes and appointment efficiency while staying HIPAA-compliant
  • Retail: Monitor sales, inventory, and marketing performance in real-time
  • Finance: Detect fraud, manage risk, and ensure compliance
  • Tech & SaaS: Analyze product usage, customer engagement, and client dashboards
  • Education & Government: Track resources, performance, and public-facing data
  • Construction: Monitor costs, track materials, and improve safety oversight

No matter your industry, Superset adapts to your specific goals.

Why Choose Andolasoft?

At Andolasoft, we go beyond just deploying tools. We help you build a complete, scalable BI solution with:

  • Expert setup and configuration
  • End-to-end support—from data connections to dashboard design
  • Custom development to match your branding and functionality
  • Flexible models that work for startups, SMEs, and large enterprises

We make Superset enterprise-ready and easy to use.

Ready to Get Started?

If you’re looking to modernize your data analytics without the high costs, Superset BI Services by Andolasoft is the solution.

  • Explore our gallery of 200+ dashboards
  • See real-time examples in action
  • Book a free consultation with our experts today

Open-source analytics. Enterprise power. Zero compromise.

A Beginner’s Guide to Embedding Superset Dashboards into Your SaaS Application

Turn Your SaaS App into a Data Powerhouse with Embedded Analytics

In today’s digital landscape, users expect more than just functionality—they expect insights. Embedding real-time dashboards directly into your SaaS application helps deliver those insights exactly where users need them.

At Andolasoft, we help SaaS businesses enhance their products with Superset BI Services, enabling embedded analytics that are fast, secure, and scalable. This beginner-friendly guide explains how you can integrate Superset dashboards into your SaaS platform without overwhelming your development team.

Why Embedded Dashboards Matter for SaaS

Embedding dashboards inside your SaaS app offers numerous advantages:

  • Provide real-time, contextual insights within the application
  • Improve product stickiness and customer satisfaction
  • Deliver white-labeled, branded analytics without switching tools
  • Eliminate the need for users to export data to third-party platforms

Superset BI Services by Andolasoft makes this process seamless with enterprise-grade features and support.

Top Benefits of Embedding Superset Dashboards

  • Cost-Efficient with No Licensing Fees: With Superset being open source, you avoid costly software licenses while gaining full customization and control.
  • 200+ Ready-to-Use Dashboards: Accelerate your integration with pre-designed dashboards for sales, finance, HR, operations, and more.
  • Real-Time Data Access: Ensure your users are working with the most current data, updated automatically and instantly.
  • 60+ Data Integrations: Superset BI Services integrates seamlessly with more than 60 data sources, offering powerful cross-platform analytics.
    • CRM & Sales: Salesforce, Zoho CRM, HubSpot, Freshsales, Pipedrive
    • Marketing: Google Ads, Facebook Ads, Mailchimp, Marketo, Campaign Monitor
    • Finance: QuickBooks, Xero, FreshBooks, Stripe, PayPal
    • HR & Payroll: BambooHR, Zoho People, Workday, ADP, Gusto
    • Project Management: Jira, Asana, Trello, Basecamp, Orangescrum
    • Chat & Collaboration: Slack, Microsoft Teams, Discord, Mattermost, Rocket.Chat, Chatwork
    • Databases: MySQL, PostgreSQL, Oracle, SQL Server, Amazon Redshift, Google BigQuery, Snowflake, ClickHouse, Apache Druid
    • File-Based Sources: Excel, CSV, JSON, Google Sheets
    • Cloud Storage & APIs: AWS S3, REST APIs, Webhooks, FTP sources
    • Custom Applications: Proprietary platforms via custom connectors
  • Role-Based Access Control (RBAC): Secure data by user role or department to ensure each user only sees what they’re authorized to view.
  • Seamless Branding & User Experience: Dashboards can be styled to match your application’s look and feel, maintaining a consistent brand experience.
  • Scalable & Secure Architecture: Built for enterprise use with support for single sign-on (SSO), audit logs, and compliance-ready features.

Real-World Use Cases Across Diverse Industries

Embedded Superset dashboards are transforming how industries use data:

  • SaaS & Technology: Deliver product analytics, user behavior insights, and client-specific dashboards directly within your platform.
  • FinTech & Banking: Power fraud detection, risk analytics, and transaction monitoring with secure, real-time data.
  • Retail & eCommerce: Visualize sales performance, inventory movement, and marketing ROI across channels.
  • FMCG (Fast-Moving Consumer Goods): Monitor distribution, shelf performance, and regional sales in real time.
  • Healthcare & Life Sciences: Build HIPAA-compliant dashboards for patient tracking, appointment management, and clinical reporting.
  • Construction & Infrastructure: Track project progress, material costs, labor utilization, and safety compliance metrics.
  • Manufacturing: Optimize production efficiency, downtime monitoring, and quality control with plant-level dashboards.
  • Education & Government: Provide transparency through public dashboards and track institutional performance.
  • Logistics & Supply Chain: Gain visibility into shipment flows, delays, and vendor performance in one unified view.

Whether your customers are tracking revenue, operations, engagement, or resource usage, Superset dashboards embedded into your SaaS app deliver critical insights—right where they matter.

Why Choose Superset BI Services by Andolasoft?

  • Expertise in Apache Superset and Enterprise BI
  • End-to-End Setup: Data Integration to Dashboard Delivery
  • Custom Embedded Analytics for SaaS Applications
  • Secure, Scalable Infrastructure Ready for Growth
  • 200+ Dashboard Templates to Jumpstart Deployment

From technical architecture to user experience, our team ensures your embedded analytics solution is robust, secure, and fully tailored to your business goals.

Ready to Embed Superset Into Your SaaS Product?

Explore our dashboard gallery with 200+ interactive templates
Schedule a free consultation with our Superset BI specialists
Let Andolasoft handle the heavy liftingwhile you scale your SaaS faster with smarter insights

Superset BI Services by Andolasoft — Embedded analytics that empower your users and transform your product.

Top 7 Benefits of Using Superset Dashboards for Real-Time Data Visualization

In today’s fast-evolving digital landscape, data isn’t just an asset—it’s the heartbeat of every successful business. To stay competitive, organizations need powerful, flexible tools that turn raw data into actionable insights quickly and accurately.

At Andolasoft, we deliver just that with Superset BI Services—an enterprise-grade business intelligence platform built on Superset BI. Combining cutting-edge features with seamless integrations and zero licensing fees, Superset BI Services empower businesses to visualize, analyze, and act on data like never before.

Let’s explore the top 7 benefits of Superset BI Services and why it’s the future of real-time data visualization for enterprises across industries.

No Expensive Licensing Fees — Enterprise Support

Why pay a premium for BI software when you can leverage the power of Apache Superset without vendor lock-in? Superset BI Services eliminates costly licensing fees and delivers a fully supported, scalable BI platform.

  • Save on upfront and recurring costs
  • Enjoy full customization without restrictions
  • Maintain total control over your analytics stack

This means faster ROI and freedom to innovate without being tied to expensive proprietary tools.

200+ Ready-to-Use Dashboards—Accelerate Time-to-Insight

Jumpstart your analytics with over 200 pre-built dashboards tailored for key departments and business functions: sales, marketing, finance, HR, operations, and more.

  • Instantly monitor vital KPIs
  • Easily customize dashboards to your needs
  • Empower every team to make data-driven decisions

Whether you’re tracking monthly recurring revenue, campaign performance, or operational efficiency, our dashboards help you get insights fast.

Real-Time Reporting — Live Data, Smarter Decisions

With Superset BI Services, say goodbye to stale reports. Our dashboards auto-refresh with live data, so you always work with the most accurate, up-to-the-minute information.

  • Detect trends and anomalies as they happen
  • Respond faster to market changes and operational issues
  • Confidently support strategic and tactical decisions

This dynamic reporting capability is a game-changer for fast-paced industries like SaaS, retail, and finance.

Connect to 60+ Data Sources — Unified, Cross-Platform Analytics

Superset BI Services integrates with an extensive array of data sources to give you a consolidated view of your business.
Key compatible platforms include:

  • CRM & Sales: Salesforce, Zoho CRM, HubSpot, CRMLeaf
  • Marketing: Google Ads, Facebook Ads, Mailchimp
  • Finance: QuickBooks, Xero, Stripe
  • HR: BambooHR, Zoho People, Workday
  • Project Management: Jira, Asana, Trello, Orangescrum
  • Chat & Collaboration: Slack, Microsoft Teams, Discord, Mattermost, Rocket.Chat, Chatwork
  • Databases: MySQL, PostgreSQL, Oracle, SQL Server
  • Files: Excel, CSV, JSON
  • Custom Applications: REST APIs for flexible data ingestion

This seamless connectivity lets you merge, enrich, and analyze data across tools, enabling powerful, data-driven decision-making.

Embed Dashboards Anywhere — Insights in Your Workflow

Bring the power of Superset dashboards directly into your apps, portals, or intranet platforms with secure and customizable embedding.

  • Enhance your SaaS product with embedded analytics
  • Deliver role-based views to internal teams or clients
  • Ensure consistent, branded reporting experiences

This approach improves adoption and puts critical insights exactly where your users need them.

Advanced Visualizations—From Basics to Cutting-Edge

Superset BI Services supports a rich visual toolkit to tell your data’s story clearly and compellingly.

  • Heatmaps for density and trend analysis
  • Treemaps to visualize hierarchical data
  • Sankey Diagrams to map flows and conversions
  • Geo Maps, Time Series, Funnels, KPI Charts, and more

These visuals help simplify complex data and enable deeper, more intuitive analysis across your teams.

Enterprise-Grade Scalability & Security — Built for Growth

Superset BI Services meet the demanding needs of modern enterprises with features including

  • Role-Based Access Control (RBAC)
  • SSO, OAuth2, LDAP integration
  • Asynchronous query processing via Celery
  • Docker & Kubernetes deployment for scalability
  • Full audit logging and compliance support (HIPAA, GDPR)

This ensures your BI infrastructure is secure, scalable, and compliant with industry regulations.

Industry Applications of Superset BI Services

Superset BI Services delivers tailored solutions across diverse industries:

Industry Applications of Superset BI Services

Why Choose Superset BI Services by Andolasoft?

At Andolasoft, we’re not just deploying BI tools—we’re transforming how you interact with data.

  • Deep expertise in Apache Superset and enterprise BI
  • End-to-end service from data integration to dashboard design
  • Flexible engagement models for businesses of all sizes
  • Commitment to delivering measurable business outcomes

Ready to Harness the Power of Real-Time BI?

Discover the difference Superset BI Services by Andolasoft can make in your data strategy:

  • Explore our live dashboard gallery with 200+ interactive examples
  • Schedule a free consultation with our Superset experts
  • Start transforming your data into your most valuable asset

Superset BI Services by AndolasoftSmart. Scalable. Enterprise-Ready