Power BI Migration Services: Amazing Steps to Boost Your ROI

Imagine running your business on outdated dashboards that take hours to refresh, missing the real-time insights your competitors are already acting on. Power BI migration services are transforming how enterprises and SMEs access data intelligence — and the ROI impact is undeniable.

A 2024 Forrester Total Economic Impact study found that organizations migrating to Microsoft Power BI realized an average 354% ROI over three years, with payback in under six months. However, many businesses stall at the starting line because migration feels complex, risky, and resource-intensive.

Therefore, this guide walks you through every critical step of Power BI migration services — from audit to go-live — so your team can move faster, smarter, and with measurable returns from day one.

What Are Power BI Migration Services?

Power BI migration services encompass the full lifecycle of moving your legacy BI environment — whether that’s Tableau, Crystal Reports, SSRS, Cognos, QlikView, or on-premise data warehouses — to Microsoft Power BI’s modern cloud analytics platform.

Specifically, these services include assessment, data modeling, report migration, governance setup, performance optimization, training, and ongoing support. Furthermore, when done right, migration eliminates technical debt, reduces licensing costs, and gives every stakeholder — from the C-suite to field sales — access to accurate, real-time data.

At Andolasoft, we have helped SMEs, SaaS companies, and enterprise teams across BFSI, NBFC, and retail sectors execute seamless Power BI migrations that deliver measurable ROI within the first quarter.

Why Businesses Are Migrating to Power BI in 2026

The push toward Power BI is not just a trend — it is a strategic business imperative. Moreover, here is what is driving the shift:

  • Cost efficiency: Power BI Pro costs significantly less than legacy platforms like Tableau Server or Cognos Analytics.
  • Microsoft ecosystem integration: Native connectors to Azure, Teams, SharePoint, Dynamics 365, and Excel eliminate data silos instantly.
  • Real-time intelligence: DirectQuery and streaming datasets give decision-makers live access to KPIs without waiting for batch refreshes.
  • Scalability: Power BI Premium Gen2 scales elastically, removing the infrastructure burden from your IT team.
  • AI-augmented analytics: Built-in AutoML, Key Influencers, Q&A, and Copilot capabilities reduce the time from data to decision.

In addition, for organizations already using Superset BI or similar open-source tools, Power BI adds enterprise governance, role-level security, and Microsoft-backed SLAs that open-source tools simply cannot match at scale.

Step 1: Conduct a Comprehensive BI Environment Audit

Before migrating a single report, you need a crystal-clear picture of what you have. Indeed, a thorough audit prevents surprise failures during cutover and ensures nothing critical gets left behind.

Key audit activities include:

  • Inventory all existing reports, dashboards, and data sources
  • Identify report owners, usage frequency, and business criticality
  • Document data flows, ETL pipelines, and refresh schedules
  • Assess data quality and identify cleansing requirements
  • Map current licensing costs vs. projected Power BI licensing spend

At this stage, our data analytics team typically discovers that 30–40% of legacy reports are either duplicated or unused. Consequently, eliminating them immediately reduces migration scope and cost.

ROI Impact: Clients who complete a formal audit reduce migration timelines by an average of 35% compared to those who skip this step. Therefore, the audit phase is never optional.

Step 2: Define a Migration Strategy and Roadmap

Not all reports should migrate at once. Instead, a phased, risk-tiered approach protects business continuity while delivering early wins that build internal confidence.

Prioritization framework:

  • Phase 1 — Quick wins: High-usage, low-complexity reports that showcase Power BI’s value immediately
  • Phase 2 — Core operational reports: Mission-critical dashboards with complex data models
  • Phase 3 — Advanced analytics: Predictive models, AI visuals, and embedded analytics

Furthermore, this roadmap directly supports your digital transformation strategy — ensuring BI migration aligns with broader modernization goals, not just IT timelines.

Step 3: Modernize Your Data Architecture

Power BI is only as powerful as the data behind it. Moreover, migration is the ideal moment to modernize your data architecture for performance, reliability, and governance.

Architecture modernization checklist:

  • Move from on-premise SQL to Azure SQL, Azure Synapse, or Fabric
  • Implement a medallion architecture (Bronze → Silver → Gold layers) for clean, structured data
  • Replace legacy ETL with Azure Data Factory or Dataflow Gen2 pipelines
  • Standardize semantic models to avoid redundant datasets across teams
  • Enable row-level security (RLS) to protect sensitive business data

As a result, our cloud infrastructure experts architect data environments that make Power BI reports refresh 5–10x faster than legacy on-premise solutions. Specifically, this is a measurable performance gain that users notice immediately.

Step 4: Migrate and Rebuild Reports in Power BI

This is where the actual migration happens. Additionally, depending on your source platform, approaches vary significantly.

From Tableau: Use the Migration Wizard or third-party tools, then manually refine visuals and DAX calculations to match Power BI’s rendering engine.

From SSRS / Crystal Reports: Leverage the RDL migration tool for basic reports. Subsequently, rebuild complex paginated reports using Power BI Report Builder for pixel-perfect output.

From Cognos / Qlik: A full rebuild is typically required. However, data models can often be repurposed with adjustments for DAX vs. SQL.

Best practices during migration:

  • Build a report validation checklist to compare output between legacy and new reports
  • Use calculation groups and field parameters to simplify complex DAX
  • Standardize color palettes, fonts, and layout grids across all reports for brand consistency
  • Implement incremental refresh on large fact tables to minimize refresh windows

In particular, our application modernization team runs parallel validation sprints — ensuring migrated reports match legacy outputs to 100% accuracy before any cutover decision is made.

Step 5: Implement Governance and Security

One of the most overlooked steps in Power BI migration is establishing a robust governance framework. Without it, you end up with sprawling workspaces, inconsistent metrics, and security vulnerabilities. Therefore, governance must be planned from day one.

Governance essentials:

  • Workspace strategy: Define Dev / Test / Production workspace hierarchy
  • Deployment pipelines: Automate promotion of content across environments
  • Certified datasets: Mark authoritative data sources to prevent shadow BI
  • Usage metrics: Monitor report consumption to retire unused content proactively
  • Data lineage: Track how data flows from source to report for audit compliance

For BFSI and NBFC clients, our data analytics for BFSI and NBFC teams layer additional compliance controls. As a result, these controls include audit logging, sensitivity labels, and Microsoft Purview integration.

In addition, strong governance connects directly to your digital governance strategy, ensuring BI assets are discoverable, trusted, and compliant across the organization.

Step 6: Enable Intelligent Automation and AI Features

Power BI’s competitive edge lies in its embedded AI capabilities. Moreover, migration is the right moment to activate these features and drive ROI beyond traditional reporting.

AI features to activate post-migration:

  • Copilot in Power BI: Let business users generate reports through natural language prompts
  • Key Influencers visual: Automatically identifies what drives KPI fluctuations
  • Anomaly Detection: Surfaces unexpected data spikes or drops in real time
  • Smart Narratives: Auto-generates plain-language summaries of dashboard insights
  • AutoML integration: Train predictive models directly within Power BI using Azure ML

Furthermore, these capabilities align with our intelligent automation services and autonomous AI assistant solutions. Ultimately, this gives your team an analytics environment that gets smarter over time, not just static dashboards.

Step 7: Train Teams and Drive User Adoption

Even the most technically perfect migration fails if users do not adopt the new platform. Therefore, change management and training are mission-critical for ROI realization.

Effective adoption strategies:

  • Run role-based training sessions (executives, analysts, operational users)
  • Create an internal Power BI Champions program to drive peer learning
  • Build a self-service report catalog so users can discover insights without IT dependency
  • Establish a Power BI Center of Excellence (CoE) to govern growth and best practices
  • Use enterprise project management frameworks to track adoption milestones against business goals

In fact, organizations that invest in structured adoption programs see 2x faster time-to-insight. Additionally, they achieve significantly higher report usage rates compared to those that skip formal training.

Step 8: Measure, Optimize, and Iterate

Migration is not a one-time event — it is the beginning of a continuous improvement cycle. Consequently, post-migration optimization directly impacts your long-term ROI.

Post-migration optimization priorities:

  • Use Power BI Premium Metrics app to monitor dataset performance and query times
  • Optimize slow DAX measures using DAX Studio and Tabular Editor
  • Review and consolidate overlapping datasets across workspaces
  • Expand embedded analytics into customer-facing portals or eCommerce platforms
  • Schedule quarterly BI reviews to align report roadmap with evolving business priorities

Meanwhile, our quality assurance team conducts periodic performance audits to ensure your Power BI environment continues to scale efficiently as data volumes grow.

Real-World ROI: Power BI Migration in Action

Here is what measurable success looks like across industries we have served:

Financial Services (BFSI): A leading NBFC migrated 120 Crystal Reports dashboards to Power BI in 12 weeks. As a result, the client achieved a 68% reduction in report generation time, 40% lower BI licensing cost, and real-time loan monitoring. For more details, see our loan monitoring system and loan analytics capabilities.

SaaS Company: The company migrated from Tableau Online to Power BI Premium. Consequently, they achieved $180K in annual licensing savings, a 3x increase in self-service report creation, and full integration with Microsoft Teams for in-context analytics.

Retail Enterprise: The retailer consolidated 14 disconnected reporting tools into a unified Power BI environment. Therefore, they gained a single version of truth across 8 regional offices, a 90% reduction in data reconciliation effort, and real-time inventory visibility driving $2.3M in working capital optimization.

Common Power BI Migration Challenges — and How We Solve Them

Understanding the pitfalls helps you avoid them. In particular, here are the most common challenges and proven solutions:

1. Complex DAX vs. Legacy Calculated Fields: Legacy platforms use proprietary calculation languages. However, our data engineers rebuild calculations in optimized DAX, often improving query performance by 50–80% in the process.

2. Data Quality Issues Surfaced During Migration: Migration exposes hidden data quality problems. Fortunately, we implement data cleansing pipelines as part of the migration — turning a challenge into a long-term data quality improvement.

3. User Resistance to Change: We address this through our structured change management program. Specifically, we identify internal champions early and build momentum before the formal go-live date.

4. Performance Bottlenecks with Large Datasets: We apply aggregation tables, composite models, and incremental refresh strategies. As a result, we ensure sub-second query performance even on billion-row datasets.

Overall, our AI framework services and enterprise integration capabilities ensure that even the most complex BI ecosystems migrate cleanly and perform reliably.

Why Choose Andolasoft for Power BI Migration Services?

With over 15 years of experience in enterprise data and analytics, Andolasoft brings a proven methodology, certified Microsoft Power BI engineers, and deep industry expertise. In addition, we serve clients across BFSI, healthcare, retail, and SaaS sectors.

What sets us apart:

  • End-to-end migration ownership — from audit through post-go-live optimization
  • Fixed-price migration packages for predictable ROI planning
  • Certified Power BI specialists with hands-on Azure and Fabric experience
  • Industry-specific compliance knowledge for regulated industries
  • Geo-spatial BI capabilities for location-driven analytics via geo-spatial engineering services
  • Continuous innovation through our Innovation & Product R&D practice

Ultimately, you can explore our full capabilities at the Andolasoft Blog and discover how we help organizations unlock the full value of their data investments.

Conclusion: Your ROI Journey Starts With the First Step

Power BI migration is not just a technology upgrade — it is a strategic investment in your organization’s ability to compete on data. Moreover, every week you delay is a week your competitors gain ground with faster insights, lower costs, and smarter decisions.

The steps outlined in this guide give you a proven roadmap: audit, strategize, modernize, migrate, govern, automate, train, and optimize. Furthermore, each phase builds on the last, compounding ROI with every milestone.

Therefore, ready to start? Book a free Power BI migration assessment with Andolasoft today — and let us build a faster, smarter analytics foundation for your business.

Frequently Asked Questions

1. What is included in Power BI migration services?

Power BI migration services include BI environment auditing, data architecture modernization, report rebuilding, governance setup, performance optimization, user training, and post-migration support. In summary, they cover the complete journey from legacy platform to Microsoft Power BI.

2. How long does a Power BI migration take?

Migration timelines depend on the volume and complexity of existing reports. For instance, small environments (under 50 reports) typically migrate in 4–8 weeks. However, enterprise migrations with 200+ reports and complex data models may take 3–6 months with a phased approach.

3. Which legacy BI tools can be migrated to Power BI?

Power BI migration services support migrations from Tableau, SSRS, Crystal Reports, Cognos, QlikView, Qlik Sense, MicroStrategy, Looker, and custom-built SQL Server reporting solutions. Furthermore, most data models can be repurposed during migration.

4. What is the ROI of migrating to Power BI?

Forrester research shows organizations achieve an average 354% ROI over three years from Power BI adoption. Specifically, key value drivers include reduced licensing costs, faster decision-making, IT efficiency gains, and improved data accuracy.

5. Is Power BI migration disruptive to daily business operations?

A well-planned phased migration minimizes disruption. Therefore, legacy systems run in parallel with Power BI during the transition period, ensuring business continuity until the new environment is fully validated.

6. What data sources does Power BI connect to?

Power BI connects to 200+ data sources natively, including Azure SQL, Snowflake, Google BigQuery, Salesforce, Dynamics 365, SharePoint, Excel, SAP, and virtually any database via ODBC or REST API connectors. Moreover, new connectors are added regularly through Microsoft updates.

7. Do we need to replace our existing data warehouse during migration?

Not necessarily. Power BI can connect to your existing data warehouse. However, migration is an ideal opportunity to evaluate modernization to Azure Synapse or Microsoft Fabric for enhanced performance and AI capabilities.

8. How does Power BI handle data security after migration?

Power BI supports row-level security (RLS), object-level security (OLS), Microsoft Purview sensitivity labels, and Azure Active Directory integration. As a result, all user roles receive enterprise-grade data protection.

9. Can Power BI embed analytics into our existing applications?

Yes. Power BI Embedded allows you to integrate interactive dashboards into web apps, portals, and SaaS products using REST APIs and JavaScript SDKs. Consequently, you can extend analytics to customers and partners without requiring Power BI licenses.

10. How do I get started with Power BI migration services from Andolasoft?

Contact the Andolasoft data analytics team to schedule a free migration assessment. We will audit your current environment, define a migration roadmap, and provide a fixed-price proposal within 5 business days. Therefore, there is no reason to delay your migration journey any further.

Unlock Amazing BI Savings With Apache Superset in 2026 Today

Every dollar counts when you run a startup or SME. Yet most companies waste $50,000 to $120,000 per year on business intelligence (BI) tools they barely use. However, there is a smarter way in 2026 — and it costs almost nothing to start. Apache Superset BI savings are real. Apache Superset is the world’s most popular open-source BI platform, trusted by Airbnb, Nielsen, and thousands of fast-growing companies. Moreover, it gives your team powerful dashboards, deep analytics, and stunning data visualization — without the enterprise price tag that breaks budgets.

In this guide, you will discover exactly how Apache Superset delivers massive BI savings. You will also learn which features make it the best choice in 2026. Additionally, see how Andolasoft’s Superset BI Services help you unlock those savings faster than ever before.

What Is Apache Superset and Why It Matters in 2026

Apache Superset is a modern, open-source BI platform. It was originally developed by Airbnb and later donated to the Apache Software Foundation. Therefore, the software is completely free to use under the Apache 2.0 license.

In 2026, the BI software market will reach $33.3 billion (Gartner). However, most of that spend goes to licensing fees — not actual insights. Apache Superset flips this model. You pay for infrastructure only, not software. As a result, your budget goes toward real analytics value.

At Andolasoft, our Superset BI Services team has deployed Apache Superset for clients across NBFC, BFSI, retail, and SaaS sectors. Furthermore, we consistently see companies slash their BI spend by 60% to 80% within the first year of migration.

Key Facts About Apache Superset

  • Over 50,000+ GitHub stars — one of the most loved open-source BI projects globally
  • Connects to 40+ databases including PostgreSQL, MySQL, BigQuery, Snowflake, and Redshift
  • Fully REST API-enabled for seamless integration with your existing tech stack
  • Built-in SQL Lab lets teams write complex queries without a separate database tool
  • Supports role-based access control (RBAC) to protect sensitive business data

The Real Cost of Traditional BI Tools in 2026

Most organizations do not realize how much they overpay for BI. Let’s look at the hard numbers hurting your bottom line right now.

Tableau charges $70–$115 per user per month. For a 50-person team, that is $42,000–$69,000 per year. Importantly, this does not include training, implementation, or support costs. Power BI is cheaper, however it locks you into the Microsoft Azure ecosystem at $10–$20 per user per month.

Beyond licensing, traditional BI platforms create hidden costs that compound quickly. These include vendor lock-in, expensive consultants for customization, and complex pricing tiers that punish growth. Therefore, switching to Apache Superset is a straightforward decision for most SMEs.

💡 Real Cost Impact: A 50-person team on Tableau spends up to $69,000/year on licensing alone. Switching to Apache Superset with managed hosting reduces this to just $3,000–$8,000/year. That is a saving of up to $61,000 annually.

Furthermore, traditional tools require specialized consultants just to build basic reports. In contrast, our Data Analytics services team enables your internal users to self-serve insights — eliminating costly dependency on outside experts.

How Apache Superset Delivers Massive BI Savings

Apache Superset does not just replace expensive BI tools. It actively creates financial advantages across your entire data operation. Here is how the savings stack up.

Zero Licensing Costs

Apache Superset is 100% open-source under the Apache 2.0 license. You pay nothing for the software itself. Consequently, your only costs are cloud hosting and optional expert implementation — both a fraction of traditional licensing fees.

Reduced Vendor Lock-In

Because Superset is open-source and database-agnostic, you are never trapped with one vendor. If you switch from MySQL to Snowflake, your dashboards follow seamlessly. Moreover, this flexibility pairs beautifully with our Cloud & Infrastructure Services, where we help you build portable, cost-efficient data pipelines.

Faster Time-to-Insight

Traditional BI implementations take 6–12 months. They also cost $80,000–$200,000 in professional services. However, a managed Apache Superset deployment with Andolasoft launches in just 4–8 weeks. This cuts time-to-value by up to 70%.

Self-Service Analytics

Superset empowers business users — not just data engineers — to build their own dashboards. This dramatically reduces analyst workload. Additionally, combined with Intelligent Automation, teams can schedule automated reports and alerts without ongoing manual effort.

Top 7 Ways Apache Superset Cuts Your BI Budget in 2026

Here are the seven proven ways Apache Superset delivers measurable cost savings for SMEs and startups.

  • Eliminates Software Licensing: No per-seat fees exist. There are zero annual license renewals. Your entire organization can access Superset simultaneously at no extra cost.
  • Reduces Infrastructure Costs: Superset runs efficiently on cloud instances from just $200–$500/month for most SMEs. This compares to $4,000–$8,000/month for enterprise BI SaaS plans.
  • Cuts Consultant Dependency: Superset’s intuitive drag-and-drop interface means business analysts build dashboards independently. As a result, costly consultant hours reduce by up to 60%.
  • Accelerates Data-Driven Decisions: Faster insights mean faster pivots. Companies using Superset report 35% faster decision cycles. This directly translates to measurable revenue impact.
  • Integrates With Existing Tools: Superset connects natively to your Python stack, React frontend, and existing databases. Specifically, our Python Development team optimizes these integrations for peak performance.
  • Enables Unlimited Users: Unlike Tableau’s per-seat pricing, Superset scales to any team size at no additional cost. Therefore, adding 100 new users costs the same as adding 10.
  • Powers Financial Analytics: For NBFC and BFSI sectors, Superset powers specialized use cases like our Loan Analytics System and Loan Monitoring System — replacing expensive proprietary financial BI tools entirely.

Apache Superset vs. Tableau vs. Power BI — 2026 Cost Comparison

Numbers speak louder than claims. Here is how Apache Superset compares against Tableau and Power BI on the metrics that matter most to budget-conscious teams in 2026.

Feature Apache Superset Tableau Power BI
License Cost Free (Open-Source) $70–$115/user/mo $10–$20/user/mo
Annual Cost (50 Users) ~$0 (hosting only) $42,000–$69,000 $6,000–$12,000
Cloud Hosting Any cloud provider Tableau Cloud only Azure only
Custom Dashboards Unlimited Limited Limited
SQL Editor Built-in Yes Not included Partial
Open-Source Apache 2.0 Proprietary Proprietary
Vendor Lock-in None High Medium

The verdict is clear. Apache Superset delivers enterprise-grade BI at a fraction of the cost. Moreover, for BFSI and NBFC organizations, the advantage is especially strong. Our specialized BFSI Data Analytics and NBFC Data Analytics solutions show exactly how industry-specific Superset deployments maximize this advantage.

Real-World Use Cases: Companies Saving Big With Apache Superset

Theory is useful. However, real results build conviction. Here are three organizations achieving meaningful BI savings with Apache Superset right now.

Use Case 1: NBFC Company Cuts Reporting Costs by 72%

A mid-sized NBFC was spending $84,000 per year on a proprietary loan reporting platform. After Andolasoft migrated them to Apache Superset — integrated with our NBFC Data Analytics framework — their annual BI cost dropped to $23,500. That is a saving of $60,500 per year. Additionally, they gained better dashboard performance and real-time loan monitoring.

Use Case 2: SaaS Startup Achieves BI in 5 Weeks

A SaaS company needed investor-ready dashboards but had no BI budget. Using Andolasoft’s Superset BI Services and our ReactJS Development team, they launched a full BI layer in just 5 weeks for under $12,000. In comparison, a Tableau implementation quote from another vendor had come in at $95,000.

Use Case 3: Enterprise Team Consolidates 6 Tools Into 1

An enterprise project management team was juggling six separate reporting tools. Our Enterprise Project Management solution consolidated all reporting into a single Superset instance. As a result, they achieved a 68% reduction in reporting overhead and 40% faster team reporting cycles.

How Andolasoft’s Superset BI Services Maximize Your ROI

Implementing Apache Superset correctly is the difference between transformational savings and a frustrating half-deployed tool. Therefore, Andolasoft’s Superset BI Services provide end-to-end expertise — from architecture design to dashboard delivery — so you realize full ROI from day one.

  • Application Modernization: We modernize legacy reporting systems before migrating to Superset. Consequently, you get zero data loss and a smooth, risk-free transition.
  • AI Framework Services: We integrate machine learning models into your Superset dashboards. This enables predictive analytics alongside standard reporting.
  • Digital Strategy & Transformation: We align your Superset implementation with your broader digital roadmap. As a result, you maximize long-term data ROI.
  • Enterprise Integration: We connect Superset to your ERP, CRM, and operational databases using industry-standard integration patterns.
  • Digital Governance Solutions: We ensure your Superset implementation meets regulatory and compliance standards — especially critical in BFSI and healthcare sectors.

For project teams, tools like OrangeScrum pair powerfully with Superset dashboards. Together, they connect project data directly to business analytics, building integrated and cost-efficient operations.

Key Features That Make Apache Superset the Best BI Choice in 2026

Apache Superset is not just affordable. It is genuinely powerful. Here are the features that make it the smartest BI investment for any SME or startup in 2026.

Rich Chart Library

Superset ships with 40+ chart types — from bar charts and heat maps to advanced funnel charts and geospatial visualizations. Furthermore, our Geo-Spatial Engineering & Services team extends these capabilities with custom map layers for logistics and field operations.

SQL Lab for Power Users

Business analysts and data engineers love Superset’s built-in SQL Lab. It supports multi-tab querying, query history, auto-complete, and results download. Therefore, teams no longer need separate database GUI tools.

Role-Based Access Control

Superset’s enterprise-grade RBAC ensures each user sees only the data they are authorized to view. This is critical for Digital Governance Solutions compliance — particularly in regulated sectors like banking and healthcare.

Embedded Analytics

Superset dashboards embed directly into your product or customer portal via its REST API. Combined with Andolasoft’s ReactJS Development expertise, we build seamless embedded analytics experiences that differentiate your product.

Autonomous AI Assistant Integration

In 2026, Superset integrates powerfully with Autonomous AI Assistants to enable natural language querying. Users simply type a question and get instant answers — no SQL knowledge required.

Step-by-Step: Getting Started With Apache Superset

Ready to deploy Apache Superset? Here is the practical 7-step path to your first dashboard and your first BI savings.

  • Audit Your Current BI Stack: Document all existing BI tools, their costs, and actual usage rates. Most teams discover 40% of their BI seats are unused.
  • Define Dashboard Requirements: Identify the 5–10 most critical dashboards your team uses daily. These become your migration priority.
  • Choose Your Cloud Infrastructure: Select a cloud provider for Superset hosting. AWS, GCP, and Azure all work excellently. Our team right-sizes your environment for cost efficiency.
  • Connect Your Data Sources: Use Superset’s connection wizard to link your existing databases and data warehouses in minutes.
  • Build Your Dashboards: Use Superset’s drag-and-drop chart builder to recreate critical dashboards — or let Andolasoft’s team handle it for you.
  • Train Your Team: Superset’s learning curve is gentle. Most business users become productive within 2–3 hours of training.
  • Monitor and Optimize: Use Superset’s built-in query performance metrics to identify slow dashboards and optimize your data models over time.

For payroll-linked analytics in workforce planning, consider pairing Superset with IndPayroll — enabling seamless HR cost reporting directly within your BI dashboards.

The Future of BI Savings: What’s Coming After 2026

Apache Superset continues to evolve rapidly. The 2026 roadmap includes native AI-powered chart recommendations, enhanced Innovation & Product R&D integrations, and improved real-time streaming dashboard support. Therefore, the cost-savings case for Apache Superset will only strengthen over time.

Additionally, as Shopify eCommerce Solutions grow in sophistication, Superset becomes the natural analytics layer for e-commerce operators. Consequently, businesses understand customer behavior, inventory trends, and campaign performance — all without paying premium analytics fees.

Furthermore, teams using our Software Quality Assurance services alongside Apache Superset benefit from rigorous testing of every dashboard. This ensures data accuracy and builds trust across your entire organization.

Conclusion: Your Apache Superset BI Savings Start Today

The evidence is clear. Apache Superset delivers enterprise-grade BI at open-source prices. For SMEs, startups, and project teams, this is one of the highest-ROI technology decisions available in 2026. Therefore, now is the perfect time to make the switch.

You do not need a million-dollar budget to have million-dollar data insights. Apache Superset — expertly implemented by Andolasoft — gives your team the analytical power to compete at the highest level. Moreover, you will spend a fraction of what your competitors pay for legacy BI tools.

Explore our full range of Superset BI Services and read more expert guides on our Andolasoft Blog. Your journey to smarter, leaner BI starts now. Additionally, explore CRMLeaf to see how data-driven CRM integrates seamlessly with your new BI strategy.

Frequently Asked Questions About Apache Superset BI Savings

1. What is Apache Superset and how does it save money?

Apache Superset is a free, open-source BI platform. It replaces costly tools like Tableau and Power BI. Since the software itself is free, your only costs are hosting and optional implementation. As a result, SMEs typically save $30,000–$60,000 per year compared to enterprise BI licensing.

2. Is Apache Superset suitable for small businesses?

Absolutely. Apache Superset is ideal for small and medium businesses precisely because it scales efficiently. You can start with a minimal cloud instance for under $200 per month. Furthermore, you scale only as your data needs grow — with zero increase in licensing costs.

3. How does Apache Superset compare to Power BI in 2026?

Apache Superset is completely free, while Power BI costs $10–$20 per user per month. Superset is also database-agnostic — it is not locked to Azure. Additionally, it supports embedded analytics more flexibly and includes a built-in SQL editor that Power BI lacks.

4. Can Apache Superset connect to my existing databases?

Yes. Apache Superset connects to 40+ data sources out of the box. These include PostgreSQL, MySQL, Snowflake, BigQuery, Redshift, and SQL Server. Moreover, Andolasoft’s team can build custom connectors for proprietary or legacy systems when needed.

5. How long does it take to deploy Apache Superset?

A standard Apache Superset deployment by Andolasoft takes 4–8 weeks from kickoff to go-live. This includes infrastructure setup, database connections, initial dashboard migration, and team training. Therefore, you get value significantly faster than traditional enterprise BI implementations.

6. Is Apache Superset secure enough for financial data?

Yes. Apache Superset includes enterprise-grade RBAC, SSL/TLS encryption, and audit logging. Furthermore, Andolasoft’s implementations — backed by our Enterprise IT Security services — add additional security hardening aligned with banking and financial services compliance requirements. Consequently, your sensitive data stays fully protected.

7. Do I need a dedicated data engineering team to use Superset?

No. While a data engineer is helpful for initial setup, Superset’s business-user-friendly interface allows analysts and non-technical managers to build dashboards independently. Additionally, Andolasoft provides training to ensure your team becomes self-sufficient quickly.

8. Can Apache Superset handle real-time data?

Yes. Apache Superset supports real-time and near-real-time dashboard refresh rates depending on your data source configuration. For streaming use cases, Andolasoft integrates Superset with Apache Kafka or similar streaming platforms. As a result, you get live operational dashboards when you need them.

9. What industries benefit most from Apache Superset BI savings?

Apache Superset delivers particularly strong ROI in NBFC, BFSI, SaaS, retail, healthcare, logistics, and manufacturing sectors. However, any industry with high data volume and a need for cost-efficient reporting can benefit enormously from a well-implemented Apache Superset solution.

10. How do I get started with Andolasoft’s Apache Superset services?

Getting started is simple. Visit Andolasoft‘s Superset BI Services page to explore our implementation packages. Alternatively, sign up for a free CRMLeaf trial to experience data-driven business management firsthand. Our team is ready to help you design the optimal Superset solution for your specific goals and budget.

How We Cut a Client’s BI Bill by 83% Using Apache Superset

Want to reduce BI costs with Apache Superset? You’re in the right place. Last year, a mid-sized e-commerce company came to us, spending $4,200/month on Tableau licenses. We helped them reduce BI costs with Apache Superset — and cut their bill by a massive 83% without losing a single dashboard they relied on.

Specifically, their CFO put it bluntly: “We’re paying a fortune just to look at our own data.”

Sound familiar? Indeed, you’re not alone. This is the full story of how we did it — every step, every number, and every result. You might also find our Apache Superset vs Tableau 2026 comparison useful as you evaluate your options.

The Problem: Tableau Costs Were Spiraling Out of Control

The client had 60 active Tableau users — a mix of Creator and Explorer licenses. Here’s what they were paying every month:

  • 10 Tableau Creator licenses × $75 = $750
  • 50 Tableau Explorer licenses × $42 = $2,100
  • Tableau Server hosting = $1,400/month

In summary, total monthly BI cost: $4,250 | Annual BI cost: $51,000.

Clearly, that’s real money — especially for a growing company still investing in product and operations. Additionally, they planned to onboard 30 more users, which would push costs past $65,000/year.

Consequently, they needed a smarter path forward. Therefore, they reached out to our business intelligence solutions team for an assessment.

According to Tableau’s own pricing page, costs scale steeply with team size — making open-source alternatives increasingly attractive for growing businesses.

How to Reduce BI Costs with Apache Superset: Why We Recommended It

In fact, many businesses choose to reduce BI costs with Apache Superset because it delivers enterprise-grade analytics at zero licensing cost. We’ve helped dozens of companies make this transition successfully.

Specifically, here’s why we recommended Superset for this client:

  • It’s 100% free. Open source under the Apache 2.0 license. No per-user fees. No annual contracts. No surprise invoices.
  • It’s powerful. Supports rich dashboards with 30+ chart types, custom SQL metrics, and role-based access control.
  • It’s scalable. Whether you have 10 users or 10,000, your costs don’t scale with user count.
  • It connected to their stack. The client used PostgreSQL and Amazon Redshift — both natively supported by Superset.

Furthermore, our BI migration services team had a proven playbook from previous successful migrations. The transition process was well-tested and reliable.

For an independent benchmark, G2’s comparison of Superset vs Tableau shows Superset consistently winning on value, with strong ratings from technical users globally.

Our Step-by-Step Migration Strategy

Importantly, we didn’t just flip a switch. This migration required careful planning, testing, and change management. Here’s exactly how we approached it.

Step 1: Audit the Existing Tableau Environment

First, our data analytics services team conducted a full audit of their Tableau setup.

Notably, we identified:

  • 47 active dashboards across 8 departments
  • 12 dashboards with zero views in the past 90 days (flagged for removal)
  • 6 critical executive dashboards needing pixel-perfect recreation
  • 4 data sources: PostgreSQL, Redshift, CSV uploads, Google Sheets

This audit gave us a clear migration roadmap. Additionally, it revealed that 25% of their Tableau dashboards were dead weight. As a result, removing them immediately reduced complexity and future maintenance effort.

Step 2: Provision the Superset Infrastructure

Next, our cloud infrastructure services team provisioned a production-ready Superset environment on AWS. We configured:

  • Superset on EC2 with autoscaling enabled
  • Redis for query result caching (dramatically improves load times)
  • PostgreSQL as the Superset metadata database
  • SSL certificates, SSO via Okta, and row-level security rules

Notably, the full setup took just 6 days. The client estimated their internal team would take 3+ months on their own. Our Apache Superset expertise made all the difference.

Step 3: Recreate All Dashboards in Superset

Undoubtedly, this was the most labor-intensive phase. Our custom dashboard development team recreated all 35 active dashboards in Superset. We prioritized the 6 executive dashboards first. Furthermore, their sign-off was essential before wider rollout.

Additionally, we also:

  • Wrote custom SQL queries to replicate Tableau’s calculated fields
  • Built a reusable “chart library” for the client’s analysts
  • Applied brand colors, fonts, and typography throughout
  • Added 14 new dashboards the team had wanted but couldn’t justify at Tableau’s pricing

Our Python development team also built two custom Superset plugins — a branded chart type and an embedded filter widget — giving the client capabilities beyond what Tableau offered.

Step 4: Team Training Program

Of course, a new tool is only as good as the people using it. Therefore, we ran structured training sessions for three groups:

  • Data engineers: SQL query building, dataset management, caching configuration
  • Analysts: Dashboard creation, chart customization, advanced filter design
  • Business users: Dashboard navigation, filter application, data export

We also provided a custom Superset implementation guide tailored to their specific environment and use cases.

Step 5: Two-Week Parallel Running Period

Subsequently, for two weeks, both Tableau and Superset ran simultaneously. Users validated that Superset dashboards matched Tableau outputs exactly. As a result, confidence built rapidly — and users actually started preferring Superset. At the end of week two, we shut down Tableau entirely.

More Than Just Cost Savings

Cutting the BI bill was the headline. However, the client gained several other improvements they didn’t anticipate.

For instance, faster dashboards were an immediate win. Superset’s Redis caching reduced average load time from 8 seconds to under 2 seconds — a remarkable 75% improvement.

Moreover, with no per-user cost, the team built 14 new dashboards previously shelved due to Tableau’s pricing. Everyone from warehouse staff to customer service now has real-time data access.

In addition, their data no longer routes through Tableau’s cloud. It sits entirely within their AWS environment — a major win for their compliance and legal teams.

Similarly, their data team prefers Superset. SQL gives them more power than Tableau’s drag-and-drop for complex analysis scenarios.

Our open source software development expertise meant we could also customize Superset’s codebase for their specific needs — something impossible with Tableau’s closed-source architecture.

Is Apache Superset Right for Your Business?

Generally, you can reduce BI costs with Apache Superset if your business meets these criteria:

  • You’re paying $20,000+ per year in BI licensing fees
  • Your team has SQL skills or you work with a Superset development partner
  • You use SQL-compatible databases (PostgreSQL, MySQL, BigQuery, Snowflake, etc.)
  • You want full ownership and control of your data environment
  • You’re planning to expand BI access to more users without scaling costs

Alternatively, if you’re not sure whether Superset is the right fit, our data visualization consulting team offers a free BI assessment to evaluate your current stack and estimate your potential savings.

What the Migration Cost vs. What It Saved

Interestingly, one question we always get: “What does the migration itself cost?”

Specifically, for this client, our enterprise software development team completed the full migration — audit, infrastructure, dashboards, and training — in 4 weeks. The migration paid for itself in less than 2 months of Tableau savings. Undeniably, that’s an ROI most software projects can only dream of.

Frequently Asked Questions

1. How long does a Tableau to Apache Superset migration take?

Typically 3–6 weeks, depending on the number of dashboards, data sources, and the complexity of your existing setup. Our BI migration services team follows a structured 5-step process — audit, infrastructure, dashboard recreation, training, and parallel running — that minimizes risk and disruption.

2. Will we lose any features by switching from Tableau to Superset?

For the vast majority of use cases, no. Superset replicates all core BI features — dashboards, filters, drill-downs, chart exports, role-based access, and SQL metrics. Explore the official Superset documentation to see the full feature set.

3. Can we migrate from Tableau to Superset without any downtime?

Yes. We always run both tools in parallel for a minimum of two weeks. Your team validates every Superset dashboard before we decommission Tableau. As a result, your team never experiences any interruption in data access.

4. How much does Superset hosting cost after migration?

Typically $400–$800/month on AWS or GCP. That’s compared to $1,000–$2,000+/month for Tableau Server infrastructure. Our cloud infrastructure team architects the most cost-effective Superset setup for your usage patterns.

5. How much does the migration itself cost?

Most clients recover the full migration cost in less than 2 months of saved Tableau fees. Our Apache Superset development team provides a detailed ROI projection during the free consultation so you can decide with confidence.

6. Can Apache Superset handle large data volumes?

Yes. Superset natively integrates with Apache Druid, Presto, and Trino — purpose-built engines for querying billions of rows in seconds. Our data analytics services team tunes your Superset infrastructure for your exact data volume.

7. Do non-technical users struggle with Apache Superset?

Non-technical users navigate and explore dashboards easily — no SQL required. The learning curve applies mainly to building new dashboards. We resolve this through a comprehensive dashboard library and data visualization training tailored to your team.

8. Is our data safe in a self-hosted Superset environment?

Absolutely. Self-hosting means your data never leaves your own cloud. We configure Superset with SSO, row-level security, LDAP/OAuth, SSL, and audit logging. Our enterprise software development team ensures compliance with SOC 2, GDPR, and HIPAA requirements.

9. What happens if we need new dashboards after migration?

Andolasoft provides full ongoing support — including new dashboard development, custom plugins, performance tuning, and version upgrades. Because Superset is open source, our open source development team can build entirely custom features, which is impossible with Tableau’s closed-source platform.

10. How do I get started with reducing BI costs using Apache Superset?

Simply put, the first step is a free BI assessment with our team. We review your Tableau setup, dashboard count, data sources, and user base. Then we provide a savings estimate and migration roadmap. Contact our BI experts today to schedule your free consultation.

Ready to Reduce Your BI Costs with Apache Superset?

If you’re spending tens of thousands on Tableau, there’s a smarter way — and we can prove it with numbers from your own environment.

Indeed, at Andolasoft, we specialize in helping businesses reduce BI costs with Apache Superset through end-to-end Apache Superset development services. From infrastructure setup and dashboard migration to team training and ongoing support, we handle everything.

In short, our clients typically save 70–85% on BI costs within 60 days of going live. Learn more about Andolasoft and our track record across industries.

Contact our BI experts today for a free consultation — no obligation, no fluff. Your data deserves better infrastructure. And your budget deserves better too.

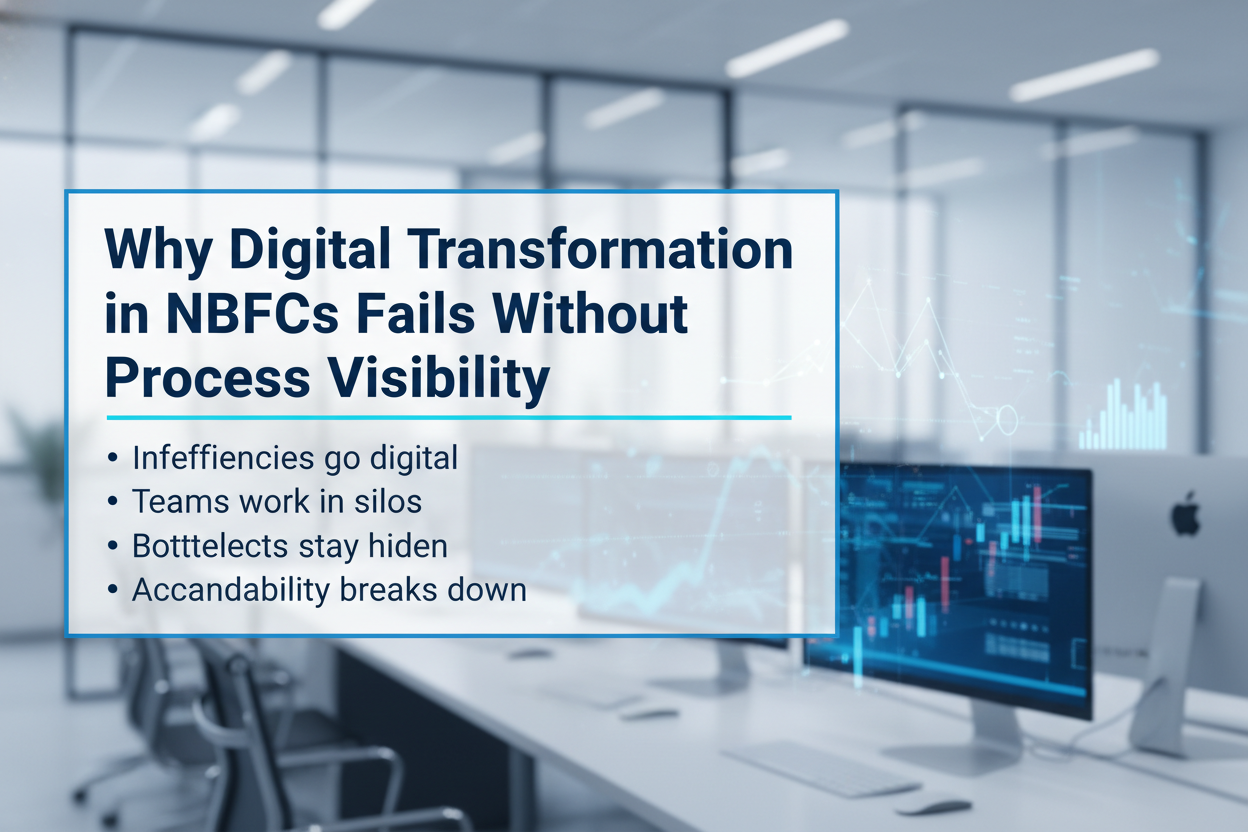
Why Digital Transformation in NBFCs Fails Without Process Visibility?

NBFCs are investing heavily in technology. They adopt loan automation platforms, CRM systems, compliance tools, and analytics dashboards. However, despite these investments, digital transformation in NBFCs often fails to deliver real business impact.

Why does this happen?

Because technology without process visibility only digitizes inefficiency.

In reality, when NBFCs lack end-to-end visibility into workflows, responsibilities, dependencies, and bottlenecks, digital transformation initiatives struggle to scale. As a result, loan turnaround time remains high, compliance risks increase, and teams continue to work in silos.

Therefore, before NBFCs can truly transform digitally, they must first fix one core issue: process visibility.

Why-NBFC-Image

What Is Process Visibility in NBFC Operations?

Process visibility refers to the ability to clearly see, track, and manage every operational step across NBFC functions such as:

  • Loan origination and underwriting
  • Credit assessment and approvals
  • Compliance checks and audits
  • Disbursement and post-loan servicing
  • Customer support and issue resolution

In other words, process visibility ensures that every task has clarity on ownership, status, dependencies, and deadlines.

Without this visibility, even the most advanced digital tools fail to align teams and workflows.

Why Digital Transformation in NBFCs Often Fails

Although NBFCs embrace digital initiatives with good intent, several structural issues prevent success. Let’s explore the most common reasons.

1. Digitizing Broken Processes Instead of Fixing Them

First and foremost, many NBFCs digitize existing workflows without improving them.

For example, instead of redesigning the loan approval process, teams simply move manual steps into software systems. As a result, delays, rework, and handoff issues remain unchanged.

Consequently, digital transformation in NBFCs becomes cosmetic rather than operational.

Without process visibility, NBFCs cannot identify inefficiencies before digitizing them.

2. Lack of End-to-End Loan Lifecycle Visibility

NBFC loan operations involve multiple departments — sales, credit, risk, compliance, and operations. Unfortunately, these teams often operate in silos.

Because of this:

  • Credit teams don’t see approval delays
  • Compliance teams miss deadline risks
  • Operations teams struggle with dependency tracking

Therefore, even though systems exist, no single source of truth reflects the real loan status.

When NBFCs lack end-to-end visibility, digital tools fail to synchronize teams and timelines.

3. Poor Task Ownership and Accountability

Another major reason digital transformation in NBFCs fails is unclear ownership.

When tasks are:

  • Assigned verbally
  • Tracked through emails or spreadsheets
  • Followed up manually

Accountability breaks down quickly.

As a result, delays become normalized, and management loses control over execution.

Process visibility ensures that every task has a clear owner, priority, and deadline, which digital tools alone cannot enforce.

4. Inability to Track Bottlenecks in Real Time

NBFCs operate in a time-sensitive environment. Even a small delay in credit verification or compliance approval can impact customer experience and revenue.

However, without process visibility:

  • Bottlenecks remain hidden
  • Escalations happen too late
  • Decisions are reactive, not proactive

Therefore, digital dashboards without execution visibility only provide surface-level insights.

True digital transformation in NBFCs requires real-time operational transparency, not just reports.

5. Compliance Risks Increase Without Visibility

Compliance is non-negotiable for NBFCs. However, when compliance activities are managed through fragmented systems, risks increase significantly.

Without clear process tracking:

  • Statutory deadlines are missed
  • Audit trails become incomplete
  • Regulatory exposure rises

Thus, digital transformation without visibility actually amplifies compliance risk instead of reducing it.

6. Resource Mismanagement Slows Down Growth

As NBFCs scale, workload complexity increases. Yet, without visibility into team capacity and task distribution, resource planning becomes guesswork.

This leads to:

  • Overloaded credit officers
  • Underutilized teams
  • Slower loan turnaround time

Hence, digital transformation in NBFCs fails to improve productivity when resource visibility is missing.

Why Process Visibility Is the Foundation of Digital Transformation

At its core, digital transformation is not about tools — it is about how work flows across the organization.

Process visibility enables NBFCs to:

  • Map workflows clearly
  • Identify inefficiencies early
  • Standardize execution
  • Improve collaboration
  • Maintain compliance control

Once visibility exists, digital systems can actually deliver value.

How NBFCs Can Build Process Visibility Before Scaling Digitally

To succeed, NBFCs must take a structured approach.

1. Centralize Workflows

All operational tasks—across credit, compliance, and operations—should be managed in a centralized system instead of scattered tools.

2. Define Clear Ownership

Every task must have a clear owner, deadline, and dependency to eliminate ambiguity.

3. Enable Real-Time Tracking

Managers should track progress, bottlenecks, and risks in real time, not through delayed reports.

4. Align Teams Through Transparency

When teams share visibility into workflows, collaboration improves naturally.

This is where platforms like Orangescrum play a critical role by providing structured work management, real-time dashboards, and execution clarity for NBFC operations.

The Business Impact of Visibility-Driven Digital Transformation

When NBFCs prioritize process visibility, they experience measurable benefits:

  • Faster loan approvals
  • Reduced compliance risks
  • Higher team productivity
  • Better customer experience
  • Scalable and predictable growth

Ultimately, digital transformation in NBFCs succeeds only when visibility drives execution.

Conclusion: Visibility First, Technology Second

To conclude, digital transformation in NBFCs does not fail because of poor technology choices. Instead, it fails because NBFCs overlook process visibility.

Technology should amplify well-defined, visible workflows — not replace them.

Therefore, NBFCs that want sustainable digital success must first build visibility across operations. Only then can digital transformation deliver speed, control, and scale.

Frequently Asked Questions (FAQs)

1. What does digital transformation in NBFCs really mean?

Digital transformation in NBFCs goes beyond adopting new software. It involves redesigning processes, improving workflow efficiency, ensuring regulatory compliance, and enabling data-driven decision-making across the entire loan lifecycle.

2. Why does digital transformation fail in many NBFCs?

Digital transformation fails mainly due to a lack of process visibility. When workflows remain fragmented across systems, NBFCs cannot identify bottlenecks, delays, or operational inefficiencies despite using digital tools.

3. What is process visibility in NBFC operations?

Process visibility refers to the ability to track, monitor, and analyze workflows end to end—from loan application to disbursal, servicing, and collections—in real time across departments and systems.

4. How is process visibility different from dashboards and reports?

Dashboards show high-level metrics, while process visibility reveals how work actually flows. It highlights handoffs, delays, exceptions, and root causes that dashboards alone cannot explain.

5. Can NBFCs achieve digital transformation with automation alone?

No. Process automation without visibility often accelerates inefficiencies. Automation works best when applied to clearly visible and optimized workflows.

6. What operational challenges arise without process visibility in NBFCs?

Common challenges include delayed turnaround time (TAT), manual follow-ups, repeated rework, lack of accountability, compliance risks, and poor customer experience.

7. How does lack of process visibility impact loan turnaround time?

Without loan process visibility, teams cannot identify where applications are stuck. As a result, delays go unnoticed until customers escalate or SLA breaches occur.

8. Why is process visibility critical for NBFC compliance?

Process visibility ensures clear audit trails, proactive exception management, and timely regulatory reporting. Without it, compliance becomes reactive and audit risks increase.

9. How does process visibility help NBFC leadership?

It provides a single source of truth, enabling leadership to identify bottlenecks, optimize resources, reduce operational costs, and make faster, data-backed decisions.

10. Does implementing process visibility require replacing existing systems?

No. Process visibility solutions typically integrate with existing systems like LOS, LMS, CRM, and core banking platforms, improving orchestration without replacing them.

11. Is process mapping too time-consuming for NBFCs?

While process mapping requires effort, the long-term cost of invisible inefficiencies—delays, compliance issues, and rework—is significantly higher.

12. How does process visibility improve customer experience in NBFCs?

With clear workflow tracking, NBFCs can reduce delays, provide accurate status updates, resolve exceptions faster, and deliver a smoother loan journey to customers.

13. What role does workflow management play in NBFC digital transformation?

Workflow management ensures seamless coordination across teams and systems. When combined with visibility, it enables scalable and predictable NBFC operations.

14. How does process visibility support scalability in NBFCs?

By standardizing and monitoring workflows, NBFCs can handle higher volumes without proportional increases in operational risk or manual effort.

15. What is the first step NBFCs should take to fix failing digital initiatives?

The first step is identifying gaps in end-to-end process visibility before adding more tools or automation. Visibility creates the foundation for sustainable digital transformation.

How to Leverage BI for BFSI Risk Monitoring & Compliance?

The BFSI sector operates in one of the most regulated and risk-sensitive environments in the global economy. Every transaction, customer interaction, and financial exposure is governed by regulatory frameworks that continue to evolve.

At the same time, digital banking, real-time payments, and fintech integrations have significantly increased operational complexity.

In this environment, BI for BFSI is no longer a reporting enhancement — it is a foundational capability.

Instead of relying on backward-looking reports and manual reconciliations, BFSI organizations are using BI to continuously monitor risk, validate compliance, and enable faster, more confident decision-making.

As a result, leadership teams gain visibility not only into what has happened, but also into what could happen next.

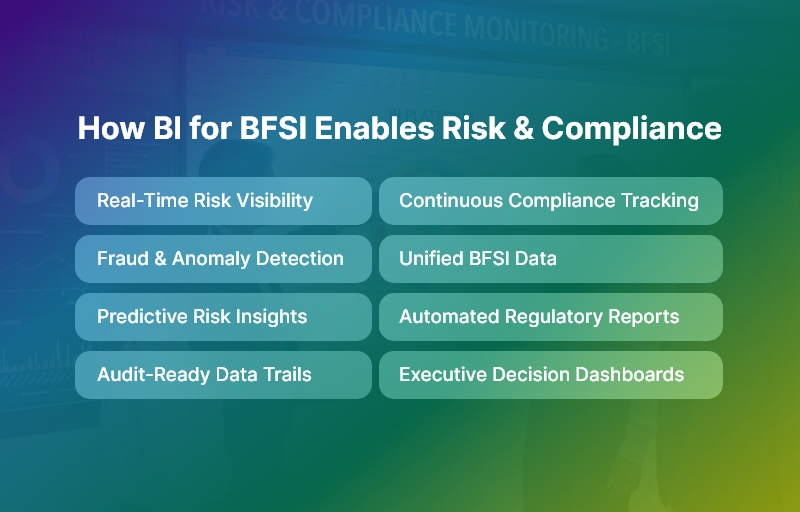
How BI for BFSI Enables Risk & Compliance

What BI for BFSI Really Means

BI refers to Business Intelligence platforms purpose-built to address the unique risk, compliance, and governance needs of banks, NBFCs, financial services firms, and insurance providers.

Unlike generic BI tools, these platforms are designed around regulatory metrics, risk-weighted analytics, and audit-ready data structures.

More importantly, BI for BFSI unifies data from core banking systems, transaction platforms, risk engines, and operational tools into a single intelligence layer.

This ensures that compliance officers, risk managers, and executives all operate from the same source of truth, eliminating inconsistencies and interpretation gaps.

Why Traditional Reporting Models No Longer Work

Many BFSI institutions still rely on static reports generated from siloed systems. While these reports satisfy basic reporting needs, they fail to support real-time risk and compliance oversight.

By the time issues surface in monthly or quarterly reviews, the damage is often already done.

Traditional reporting struggles because it is reactive, fragmented, and highly manual. Compliance teams spend excessive time compiling data, validating numbers, and responding to audit queries.

BI for BFSI replaces this inefficiency with continuous intelligence, allowing teams to focus on risk mitigation rather than data preparation.

How BI for BFSI Supports Core Risk Monitoring

Credit Risk Management

Credit risk is dynamic by nature. Borrower behavior, economic conditions, and sectoral exposure change constantly.

BI for BFSI enables institutions to track these changes in near real time, providing early warning indicators before risks materialize.

Rather than waiting for defaults or overdue accounts, credit teams can proactively assess portfolio health, stress-test exposure, and rebalance risk.

This shift from reactive to predictive credit management is one of the most valuable outcomes of BI for BFSI adoption.

Market Risk Visibility

Market volatility directly impacts treasury operations, investment portfolios, and trading desks.

Small fluctuations in interest rates or foreign exchange markets can significantly affect profitability and capital adequacy.

With BI for BFSI, institutions gain continuous visibility into market exposure.

Real-time dashboards allow leadership to understand sensitivity, simulate adverse scenarios, and align risk appetite with actual market conditions.

Consequently, decisions become data-driven rather than assumption-based.

Operational Risk Control

Operational risk often emerges quietly — through process inefficiencies, system outages, or control failures. These risks are difficult to manage without integrated visibility across departments and branches.

BI for BFSI consolidates operational data, making it easier to identify recurring incidents, process bottlenecks, and control weaknesses.

Over time, organizations can correlate operational risk events with financial impact, enabling targeted improvements and stronger internal controls.

Fraud Risk Detection

Fraud risk has intensified with digital channels and real-time transactions. Manual review processes are no longer sufficient to detect sophisticated fraud patterns.

BI for BFSI enhances fraud monitoring by analyzing transaction behavior, identifying anomalies, and triggering alerts based on predefined risk thresholds.

This intelligence-led approach allows fraud teams to act faster, reduce losses, and improve customer trust.

Strengthening Compliance Through BI for BFSI

Compliance is no longer a periodic exercise. Regulators expect continuous oversight, transparency, and traceability.

BI enables this shift by embedding compliance monitoring directly into operational workflows.

Instead of checking compliance after the fact, institutions can continuously track regulatory thresholds, monitor policy adherence, and flag exceptions before violations occur.

This proactive approach significantly reduces regulatory risk and improves supervisory confidence.

Automated Regulatory Reporting and Audit Readiness

Regulatory reporting demands precision, consistency, and defensible data lineage. Manual reporting processes increase the risk of errors and audit findings.

With BI for BFSI, regulatory reports are generated directly from validated source data. Every metric is time-stamped, traceable, and version-controlled.

As a result, audit readiness becomes an outcome of daily operations rather than a last-minute effort.

Key Capabilities Required in BI for BFSI Platforms

To deliver real value, BI for BFSI platforms must include:

  • Unified data integration across core banking, ERP, CRM, and risk systems
  • Role-based dashboards for compliance, risk, and executive teams
  • Drill-down analytics for investigation and root-cause analysis
  • Predictive insights for emerging risk trends

These capabilities ensure BI supports governance and decision-making, not just visualization.

Best Practices for Implementing BI for BFSI

Successful BI initiatives begin with regulatory and risk priorities rather than dashboard design.

Organizations should standardize data definitions early, design role-specific KPIs, and automate alerts instead of relying solely on reports.

Most importantly, BI should be treated as a governance and control platform.

When aligned with compliance objectives, BI for BFSI becomes a long-term strategic asset rather than a short-term analytics project.

The Future of BI for BFSI

Looking ahead, BI for BFSI will increasingly incorporate AI-driven risk prediction, automated regulatory intelligence, and ESG risk monitoring.

As regulations become more complex and data volumes continue to grow, institutions with advanced BI capabilities will be better positioned to adapt, comply, and scale securely.

Final Thoughts: BI for BFSI as a Strategic Imperative

In today’s BFSI landscape, risk monitoring and compliance define institutional resilience.

Organizations that depend on fragmented reporting remain exposed to regulatory and operational shocks.

Those that adopt BI gain continuous visibility, predictive insight, and audit-ready governance.

By transforming data into intelligence, BI for BFSI enables banks and financial institutions to move faster, comply smarter, and operate with confidence in an increasingly regulated world.

How BI for Retail Helps Brands Optimize Inventory & Sales?

Retailers today face unpredictable consumer demand, rising costs, and fierce competition across every channel. Traditional reporting methods can’t keep up with rapid shifts in buying behavior and supply chain disruptions. This is where BI for Retail becomes a strategic game changer. It empowers retail leaders with real-time visibility into sales, stock, customers, and profitability — enabling faster and smarter decisions that drive performance.

This guide explains how BI for Retail transforms data into insights that help brands optimize inventory and maximize sales growth.

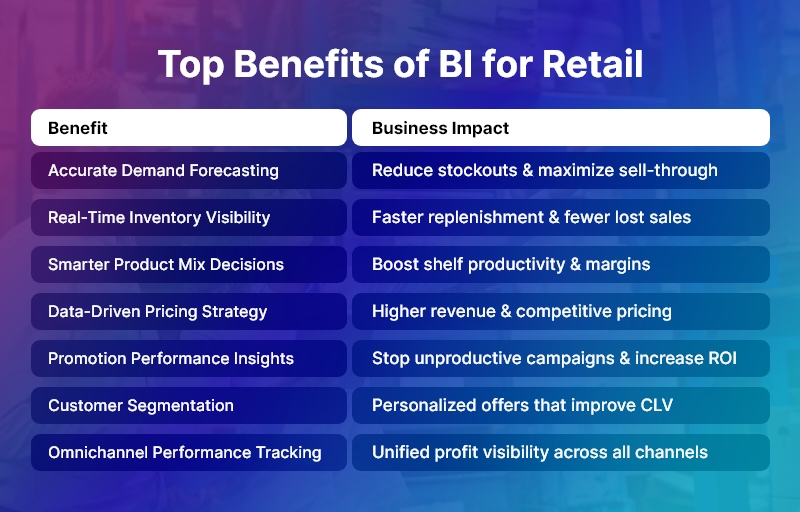
Top Benefits of BI for Retail

What is BI for Retail?

BI for Retail refers to the use of business intelligence tools, analytics, and data visualization designed specifically for retail operations. It consolidates data from:

→ Giving retailers a single source of truth for accurate, fast decision-making.

Why Retailers Need BI Today

Retail Challenge BI for Retail Solution
Overstocking or stockouts Smart demand forecasting & replenishment optimization
High inventory carrying costs Better space utilization & inventory turnover
Limited insights into product performance Real-time SKU profitability
Ineffective promotions Campaign analytics & customer response insights
Slow reporting & decision delays Instant dashboards & automated KPIs
Omnichannel visibility issues Unified analytics across online & offline

How BI Optimizes Inventory

BI ensures the right products are available at the right place and time — without excess waste.

Accurate Demand Forecasting

Predict future sales using:

  • Historical demand
  • Regional trends
  • External factors (weather, holidays)

➡ Lower stock imbalance & higher sell-through rates.

Real-Time Inventory Tracking

Centralized dashboards show exact inventory status across:

  • Stores
  • Warehouses
  • Online channels

➡ Faster replenishment & reduced lost sales.

Safety Stock Optimization

Analytics determine optimal stock buffers to avoid:

  • Stockouts
  • Rush orders
  • Customer dissatisfaction

Supplier Performance Insights

Measure vendor lead time, quality, and delivery reliability.

➡ Fewer delays + stronger procurement strategy.

Shrinkage & Waste Reduction

Retail BI detects:

  • Theft & pilferage patterns
  • Food/perishable spoilage
  • Storage inefficiencies

➡ Better bottom-line performance.

How BI Improves Sales Performance

Smarter Product Mix & Assortment Planning

Analyze:

  • Fast/slow movers
  • Store-level preferences
  • Cross-selling patterns

➡ Improve shelf productivity & margins.

Data-Driven Pricing Optimization

Use real-time pricing intelligence:

  • Margin impact
  • Competitor pricing
  • Customer elasticity

➡ Higher revenue with competitive pricing.

Promotion Analytics

Identify which offers truly drive:

  • Sales uplift
  • Repeat purchase
  • Basket value

➡ Stop spending on unproductive campaigns.

Customer Segmentation & Personalization

BI for Retail leverages RFM scoring to:

  • Reward loyal customers
  • Target offers precisely
  • Increase Customer Lifetime Value (CLV)

Omnichannel Performance Tracking

Bring together:

➡ Holistic insight into profitability across channels.

Key Retail KPIs Tracked Through BI

Inventory Metrics

  • Sell-through rate
  • Inventory turnover ratio
  • Days of inventory on hand
  • Stockout percentage

Sales Metrics

  • Gross margin return on investment (GMROI)
  • Basket size & conversion rate
  • Promo-driven sale percentage
  • Customer retention rate

➡ Retailers can monitor performance in real time.

Systems Integrated with BI

System Example Tools
POS Shopify POS, Square, Lightspeed
ERP SAP, Oracle, Tally
CRM Salesforce, HubSpot, Zoho
eCommerce Platforms Shopify, Magento, WooCommerce
Supply Chain Mgmt WMS, delivery analytics

Integration removes data silos for a unified retail intelligence ecosystem.

AI & Predictive Analytics in BI for Retail

Retail BI uses artificial intelligence to:

  • Predict future demand accurately
  • Suggest automated stock replenishment
  • Forecast the impact of promotions
  • Optimize pricing based on trends
  • Reduce overstock of declining products

➡ Better decisions with less manual effort.

BI for Multi-Location Retail

Benefit Business Impact
Store performance benchmarking Invest where growth is highest
Regional demand analysis Improve stock availability per location
Centralized analytics Consistent business reporting
Data-driven store expansion decisions Maximize ROI

Scalable intelligence for growth-oriented retail networks.

Short Case Example

A lifestyle retailer used BI for stock optimization:

Before BI After BI
22% lost sales due to stockouts <7% lost sales
Overpricing slow-moving stock Dynamic pricing increased sales
Manual, delayed reporting Real-time dashboards

Result: 12% revenue growth & increased customer satisfaction

Best Practices for BI for Retail Implementation

Best Practice Why It Matters
Prioritize clean and standardized data Accurate insights need reliable data
Define KPIs clearly Focus effort on business outcomes
Train teams for daily use Improve adoption across stores
Start with quick wins Build confidence in BI value
Scale to advanced analytics Predictive insights deliver higher ROI

Conclusion

Retail success now depends on data-driven agility — not guesswork.

BI for Retail helps brands:

  • Optimize inventory levels
  • Maximize sales and profitability
  • Improve customer satisfaction
  • Deliver an efficient omnichannel experience
  • Make informed, fast decisions at every level

Retailers that leverage BI for Retail build strong competitive advantages and unlock sustainable growth.

FAQs

How does BI for Retail help reduce stockouts?

It predicts demand and monitors inventory instantly, ensuring timely replenishment.

Can small retail businesses use BI?

Yes — cloud BI offers affordable, easy-to-adopt analytics.

How does BI improve retail profitability?

By optimizing pricing, reducing waste, and maximizing product performance.

What kind of data feeds BI?

POS, ERP, CRM, supply chain, and eCommerce data.

Does BI support omnichannel retail?

Absolutely — it unifies insights across online and in-store experiences.