Superset Plugin Compatibility: What Breaks Between 3.x and 4.x and How to Migrate a Plugin

A custom chart plugin is compiled into the Superset frontend bundle. That is what makes it fast and first-class, and it is also why an upgrade can break it: the plugin is built against one version of @superset-ui/core and @superset-ui/chart-controls, and after the upgrade it runs against another. Minor releases rarely matter. Major ones, and the 3.x to 4.x jump in particular, changed enough that most plugins need at least a rebuild and some need real changes.This post is the checklist we work through when we carry a plugin across that line. It assumes you have a plugin structured the way the build guide describes: index.ts, buildQuery.ts, controlPanel.ts, transformProps.ts and a React component, registered in MainPreset.js.

One caveat up front. The exact list of breaking changes depends on the two versions you are moving between. The authoritative source is UPDATING.md in the Superset repository, read for every release between your current tag and your target. What follows is the set that has affected plugins we maintain.

Why plugins break at all

Three kinds of coupling exist between a plugin and the Superset it runs in:

  • Package coupling. The plugin imports from @superset-ui/core, @superset-ui/chart-controls and often @superset-ui/plugin-chart-echarts. These packages live inside the Superset monorepo and are versioned with it. A type that was exported in one version may be renamed or removed in the next.
  • Behavioural coupling. The plugin relies on how Superset builds queries, passes form data, applies filters and handles cross-filter events. Feature flags that flip their default between versions change this behaviour without changing any API.
  • Toolchain coupling. The plugin is compiled by Superset’s webpack, TypeScript and Babel configuration, on the Node version the Superset frontend requires. A stricter TypeScript setting or a newer Node can fail a build that has not changed.

Most upgrade pain comes from the second and third, because they do not show up as type errors.

What changed between 3.x and 4.x that plugin authors notice

Node and build tooling

The 4.x frontend requires Node 18. If your plugin’s CI still runs Node 16, the first symptom is a build failure with no obvious connection to your code. Align the Node version in your plugin repository, your Dockerfile and your CI with superset-frontend/package.json at the target tag.

TypeScript configuration also tightened across the 3.x line. Code that compiled with implicit any or loose null checks can start failing. Fix the types rather than loosening the config; the Superset build uses its own settings, not yours.

Peer dependency pins

Every plugin declares @superset-ui/core and @superset-ui/chart-controls as peer dependencies pinned to specific versions. Those versions moved through the 3.x and 4.x releases. A mismatch produces one of two failures:

  • The package manager resolves two copies of @superset-ui/core into the bundle. Registries and theme contexts are singletons, so the plugin’s copy cannot see the charts, colour schemes or theme registered by Superset’s copy. The symptom is an error along the lines of “theme is undefined” or a chart that never appears in the picker.
  • A type or helper the plugin imports no longer exists at the new version, which is a compile error and at least easy to find.

Update the pins to match the target Superset before doing anything else.

Time range and axis controls

The GENERIC_CHART_AXES feature flag, which lets any column be the x-axis and moves the time range into ad-hoc filters, became the default behaviour in the 3.x line and is the only behaviour in 4.x. Plugins built for 2.x or early 3.x often still use the legacy time section:

typescript
controlPanelSections: [
  sections.legacyRegularTime,
  // ...
]

This still compiles, and for regular (non-time-series) charts it still works. For time-series plugins it produces a control panel that does not match the rest of the product: users expect a time column and a time grain as controls, and the time range as a filter. Move to the generic axis pattern used by the ECharts time-series plugins: an x_axis control, a time_grain_sqla control, and no legacy time section. Your buildQuery then reads formData.x_axis and includes it in columns rather than assuming a __timestamp column.

Filter box removal

Superset 4.0 removed the legacy filter box chart. Plugins are rarely affected directly, but dashboards that used filter boxes to drive your chart now drive it through native filters, which arrive in extra_form_data on the query object. If your buildQuery manipulated extras or filters by hand, check that native filter values still reach the query. The buildQueryContext helper handles this correctly; hand-rolled query construction sometimes does not.

Cross-filter behaviours

Cross-filtering matured across 3.x and is on by default in 4.x. A plugin that declares Behavior.InteractiveChart is expected to emit and respond to cross-filters properly. Two things to check:

  • Emitting. The plugin should call setDataMask with both extraFormData.filters and filterState.value when the user selects an element, and clear both on deselect. Plugins that set only one of these leave the dashboard in an inconsistent state.
  • Receiving. When another chart filters this one, the filter arrives through the normal query path. Verify the chart re-queries rather than showing stale data.

If the plugin cannot participate in cross-filtering, remove Behavior.InteractiveChart from its metadata so the dashboard does not offer the option.

Theme tokens and styling

Superset’s theme object gained and reorganised tokens through 3.x. Plugins that reach into theme.colors.* or theme.gridUnit should be checked against the theme type exported by the target @superset-ui/core. Hard-coded colours keep working but look wrong in a customised deployment, which is the moment stakeholders notice.

Note for readers on the 5.x line: Superset 5 replaced the theme system with Ant Design 5 design tokens and a JSON theme format. That is a larger change than anything in 3.x to 4.x and deserves its own migration pass.

Content Security Policy

4.0 turned on Flask-Talisman and its Content Security Policy by default. Plugins that load scripts, fonts or images from external domains, for example a map tile server or a CDN-hosted library, are blocked unless TALISMAN_CONFIG allows those origins. This is a deployment change rather than a plugin change, but the plugin author is usually the one who has to explain the blank map.

Legacy visualisation migrations

4.0 completed the migration of several legacy charts to their ECharts replacements and removed the old implementations. This matters to plugin authors in one specific case: if your plugin extended or copied code from a legacy chart, the shared code it borrowed may be gone. Search your plugin for imports from legacy-plugin-chart-* packages.

Got more than one custom plugin to check?

Auditing every plugin against this list scales badly past two or three. A Plugin Scoping Call gets you a migration estimate across your whole plugin set, not just one at a time.

Book a Plugin Scoping Call

How to find out which of these affect you

Do this before touching any code.

  • Read `UPDATING.md` from your current tag to the target tag. Note every entry that mentions the frontend, feature flags, @superset-ui, or chart behaviour.
  • Diff the feature flag defaults between the two versions in superset/config.py. Any flag that flipped and touches charts or dashboards is a behavioural change your plugin will see.
  • Check the two package versions of @superset-ui/core and @superset-ui/chart-controls in superset-frontend/package.json at both tags, and read the changelogs for those packages.
  • Grep your plugin for the things listed above: legacyRegularTime, __timestamp, setDataMask, theme.colors, hard-coded colours, external URLs, and any import from a legacy- package.

You now have a list. Usually it is short.

Migration sequence

Work in this order; each step gives you a stable checkpoint.

  • Branch the plugin and name the branch for the target Superset version.
  • Bump the peer dependencies and dev dependencies to the target versions. Set Node to the target version.
  • Build the plugin alone (npm run build). Fix compile and type errors. This clears the package coupling.
  • Link it into a Superset checkout at the target tag and run the dev server. Open the chart in Explore. This surfaces registry and theme problems immediately.
  • Work through the behavioural list: time controls, filters, cross-filters, CSP. Test each in a dashboard, not only in Explore, because filters and cross-filters only exist on dashboards.
  • Restore or re-record thumbnails if the chart’s appearance changed.
  • Run the tests and update fixtures for any changed ChartProps shape.
  • Build the production image from the target tag with the plugin included, deploy to staging, and load every saved chart that uses the plugin. A saved chart carries the form data it was created with; charts saved under the old control panel are where migration bugs hide.

Budget half a day for a minor version and one to two days for a major one, assuming a single plugin of moderate complexity. Multiply for plugins that render maps or use WebGL.

Tests that make the next upgrade cheaper

  • Golden `ChartProps` fixtures. Save a real chartProps object from the running product for each chart configuration you support and assert transformProps output against it. When the shape changes, the diff tells you exactly what moved.
  • Saved-chart smoke test. A script that lists every saved chart with your viz_type and loads each one’s data endpoint. Run it against staging after every upgrade.
  • Control panel snapshot. A test that renders the control panel config and snapshots the control names. A rename in sharedControls shows up here instead of in production.

Keeping the fork thin

The lines you maintain inside the Superset repository should be two: the dependency in superset-frontend/package.json and the registration in MainPreset.js. Every upgrade is a rebase of those two lines onto the new tag. If your fork has grown beyond that, the upgrade cost is no longer about the plugin, and it is worth moving the extra code into the plugin package or a separate extension before the next major version.

Frequently Asked Questions

Will my Superset 3.x plugin work on 4.x without any changes?

Sometimes, but do not plan for it. A plugin that only uses stable @superset-ui/core exports and no time-range controls often survives untouched. Anything that uses the legacy time section, the filter box, hard-coded colours or the older cross-filter callbacks will need work. The only reliable answer comes from building the plugin against the target version and reading the errors.

What is the most common cause of a plugin breaking after a Superset upgrade?

Two copies of @superset-ui/core in the same bundle. Registries and theme contexts are singletons, so when the plugin’s copy differs from Superset’s copy, the plugin cannot see the charts, colour schemes or theme that Superset registered. It usually surfaces as “theme is undefined” or a chart that never appears in the picker. Align the peer dependency pins before investigating anything else.

The filter box was removed in 4.x. Do I have to rewrite my plugin?

Only if your plugin depended on it. The filter box was a chart type, not a plugin API, so most custom charts are unaffected. What does change is the surrounding dashboard: filters now come from native dashboard filters and cross-filters, so a plugin that read filter state the old way needs updating to the current hooks.

How long does a 3.x to 4.x plugin migration usually take?

For a single plugin with current dependency pins and no legacy time controls, a day is realistic, most of it spent on the build tooling and the test pass. Plugins that span more than one major version, borrow from legacy chart code, or have no tests take substantially longer, and the estimate is worth getting before the upgrade is scheduled rather than after.

Build It With Andolasoft

If the plugin was written by someone who has left, if it borrows from legacy chart code, or if the upgrade spans more than one major version, the cheapest first step is a scoping conversation rather than a spike. Our Plugin Scoping Call is free and 45 minutes; you leave with a written estimate of the migration effort. The wider service is described on the Superset plugin development page, and if the upgrade itself is the worry, the Architecture Review covers upgrade readiness for the whole deployment.

If a Superset upgrade is already on the calendar and the custom charts are the unknown, book a Plugin Scoping Call. We will review the plugins you have, tell you which of the changes above apply to each, and give you a written migration estimate before you commit to an upgrade date.
How to Build a Custom Chart Plugin for Apache Superset 4.x

Apache Superset ships with more than fifty chart types, and for most dashboards that is plenty. Then someone asks for a bullet chart against a target band, a Sankey with a custom node order, a map layer the built-in deck.gl charts do not offer, or a KPI tile that colours itself against three thresholds instead of one. At that point you have two options: bend an existing chart until it almost fits, or write a plugin.Plugins are how Superset itself is built. Every chart in the Explore view, from the humble table to the ECharts time series, is a plugin registered through the same ChartPlugin API you are about to use. Nothing about a custom plugin is second-class. It gets the same query layer, the same control panel framework, the same dashboard filters and cross-filters, and the same theming.

This guide builds a small but complete plugin for Superset 4.x. The chart is deliberately simple, a bar per category with a configurable highlight threshold, so that the plugin mechanics stay in focus. Swap the rendering for ECharts, D3, or deck.gl once the plumbing is in place.

What a plugin is made of

A Superset chart plugin is an npm package that exports a class extending ChartPlugin from @superset-ui/core. The class wires together five things:

Piece File Job
Metadata index.ts Name, description, thumbnail, category, tags, and behaviours shown in the chart picker
Query builder buildQuery.ts Turns the form data from the control panel into one or more query objects for Superset’s backend
Control panel controlPanel.ts Declares which controls appear in Explore and how they are grouped
Props transformer transformProps.ts Converts raw query results and form data into the props your component needs
Component HelloChart.tsx The React component that draws the chart

The flow at runtime is: the user changes a control, Superset runs buildQuery, sends the query to the backend, receives rows, calls transformProps with those rows plus the form data, and renders your component with the result. Controls flagged as renderTrigger skip the query and go straight to transformProps, which is how colour and label changes stay instant.

Prerequisites

  • Node.js at the version your Superset release pins. Read the engines field in superset-frontend/package.json at the tag you deploy rather than trusting a blog post: the 4.x line started on Node 18 and later releases accept Node 20 as well. Use nvm or fnm; a mismatched Node version is the most common cause of a build that fails for no obvious reason.
  • A checkout of the Superset repository at the exact tag you run in production, for example git clone --branch 4.1.1 https://github.com/apache/superset.git. You will run the frontend dev server from it and, later, build the production image from it.
  • A running Superset backend to develop against. The repo’s docker-compose setup works, or a local superset run -p 8088 --with-threads --reload --debugger.
  • Working knowledge of React and TypeScript. Plugins are TypeScript by default and there is no reason to fight that.

Step 1: Scaffold the plugin

Superset maintains a Yeoman generator that produces a working plugin skeleton. Install it and run it in a new directory next to, not inside, your Superset checkout:

bash
npm install -g yo @superset-ui/generator-superset

mkdir superset-plugin-chart-hello
cd superset-plugin-chart-hello
yo @superset-ui/superset

Answer the prompts: choose Chart plugin, accept the package name, add a one-line description, and pick Regular as the chart type (choose Time-series if your chart has a time axis; it changes the default controls). The generator writes a package.json, TypeScript config, Jest setup, a src/ folder with the five files above, and a src/images/thumbnail.png placeholder.

If the published generator lags behind the Superset version you are targeting, run it from your checkout instead:

bash
cd superset/superset-frontend/packages/generator-superset
npm install
npm link
cd ../../../../superset-plugin-chart-hello
yo @superset-ui/superset

Open package.json and check the peerDependencies. The generator pins @superset-ui/core and @superset-ui/chart-controls to the versions in the checkout you ran it from. These must match the Superset you deploy, or the plugin will compile against one API and run against another.

Step 2: The five files

The generated code works as-is. The point of walking through each file is to know what to change when your chart needs something different.

index.ts: metadata and wiring

typescript
import { t, ChartMetadata, ChartPlugin } from '@superset-ui/core';
import buildQuery from './buildQuery';
import controlPanel from './controlPanel';
import transformProps from './transformProps';
import thumbnail from './images/thumbnail.png';

export default class HelloChartPlugin extends ChartPlugin {
  constructor() {
    const metadata = new ChartMetadata({
      name: t('Hello Chart'),
      description: t('One bar per category, with bars above a threshold highlighted.'),
      thumbnail,
      category: t('Custom'),
      tags: [t('Comparison'), t('Custom')],
    });

    super({
      buildQuery,
      controlPanel,
      loadChart: () => import('./HelloChart'),
      metadata,
      transformProps,
    });
  }
}

loadChart is a dynamic import so the component is code-split and only downloaded when someone opens a dashboard that uses it. Wrap every user-visible string in t() so it goes through Superset’s translation layer.

Note what is not here: a behaviors array. Adding Behavior.InteractiveChart tells Superset the chart emits cross-filters, and it does put cross-filter controls in the UI, but the affordance does nothing until your component actually calls setDataMask, which Superset passes in through chartProps.hooks. Declaring the behaviour before you wire the hook produces a menu item that silently fails. Add the behaviour and the hook together, or neither. Dashboard native filters apply to your chart either way; they arrive as part of the query, not through this flag.

buildQuery.ts: from form data to a query

typescript
import { buildQueryContext, QueryFormData } from '@superset-ui/core';

export default function buildQuery(formData: QueryFormData) {
  const { cols: groupby } = formData;
  return buildQueryContext(formData, baseQueryObject => [
    {
      ...baseQueryObject,
      groupby,
    },
  ]);
}

buildQueryContext assembles a query object from the standard controls (metrics, filters, row limit, time range) and hands it to your callback. You return an array of query objects; one is normal, two or more is how charts like the big number with trendline fetch both a total and a series. The generator names the group-by control cols and maps it onto the query’s groupby. Recent Superset versions also accept columns; either works on 4.x.

controlPanel.ts: what the user can change

typescript
import { t, validateNonEmpty } from '@superset-ui/core';
import {
  ControlPanelConfig,
  sharedControls,
} from '@superset-ui/chart-controls';

const config: ControlPanelConfig = {
  controlPanelSections: [
    {
      label: t('Query'),
      expanded: true,
      controlSetRows: [
        [
          {
            name: 'cols',
            config: {
              ...sharedControls.groupby,
              label: t('Category column'),
              description: t('One bar per distinct value'),
            },
          },
        ],
        [
          {
            name: 'metrics',
            config: {
              ...sharedControls.metrics,
              validators: [validateNonEmpty],
            },
          },
        ],
        ['adhoc_filters'],
        ['row_limit'],
      ],
    },
    {
      label: t('Hello Chart options'),
      expanded: true,
      controlSetRows: [
        [
          {
            name: 'threshold',
            config: {
              type: 'TextControl',
              isInt: true,
              default: 0,
              renderTrigger: true,
              label: t('Highlight threshold'),
              description: t('Bars at or above this value are highlighted'),
            },
          },
        ],
        [
          {
            name: 'highlight_color',
            config: {
              type: 'ColorPickerControl',
              default: { r: 26, g: 169, b: 202, a: 1 },
              renderTrigger: true,
              label: t('Highlight colour'),
            },
          },
        ],
      ],
    },
  ],
};

export default config;

Two things to notice. First, sharedControls gives you the same metric, group-by and filter controls every built-in chart uses, so the Explore experience is consistent. Second, renderTrigger: true on the threshold and colour controls means changing them re-renders without re-querying the database. Anything that only affects drawing should be a render trigger; anything that changes what data comes back should not.

The generator’s template may also import a sections helper and open the panel with a time section such as sections.legacyRegularTime. Whether that export exists depends on the release you pin: the time controls were reworked across the 4.x line as the generic chart axes behaviour became the default. Check what your @superset-ui/chart-controls actually exports before importing it, because a missing export takes out the whole control panel rather than one control. The config above needs no time section at all; adhoc_filters covers time filtering.

Control names are snake_case here. They arrive in transformProps as camelCase (highlight_color becomes highlightColor), because ChartProps runs the form data through a camelCase conversion and keeps the original on rawFormData. This conversion is the single most common source of “my control value is undefined”.

transformProps.ts: shaping data for the component

typescript
import { ChartProps, DataRecord } from '@superset-ui/core';

export interface HelloChartProps {
  width: number;
  height: number;
  data: DataRecord[];
  categoryColumn: string;
  metricLabel: string;
  threshold: number;
  highlightColor: string;
}

export default function transformProps(chartProps: ChartProps): HelloChartProps {
  const { width, height, formData, queriesData } = chartProps;
  const { cols, metrics, threshold, highlightColor } = formData;

  const data = (queriesData[0]?.data ?? []) as DataRecord[];
  const metric = metrics?.[0];
  const metricLabel =
    typeof metric === 'string' ? metric : metric?.label ?? 'value';
  const rgba = highlightColor
    ? `rgba(${highlightColor.r}, ${highlightColor.g}, ${highlightColor.b}, ${highlightColor.a})`
    : '#1aa9ca';

  return {
    width,
    height,
    data,
    categoryColumn: Array.isArray(cols) ? cols[0] : cols,
    metricLabel,
    threshold: Number(threshold) || 0,
    highlightColor: rgba,
  };
}

queriesData is an array with one entry per query object you returned from buildQuery. Each entry has a data array of row objects keyed by column or metric label. Metrics can be plain strings (saved metrics) or ad-hoc metric objects with a label; handle both. Keep this function pure and cheap; it runs on every render trigger.

HelloChart.tsx: the component

tsx
import React from 'react';
import { styled } from '@superset-ui/core';
import { HelloChartProps } from './transformProps';

const Wrapper = styled.div<{ height: number; width: number }>`
  height: ${({ height }) => height}px;
  width: ${({ width }) => width}px;
  box-sizing: border-box;
  display: flex;
  align-items: stretch;
  gap: 6px;
  padding: 8px;
  font-family: ${({ theme }) => theme.typography.families.sansSerif};
`;

/* One column per row: bar area on top, label pinned underneath. */
const Column = styled.div`
  flex: 1 1 0;
  min-width: 0;
  display: flex;
  flex-direction: column;
`;

/* Gives the bar a definite height to take a percentage of. */
const BarArea = styled.div`
  flex: 1 1 auto;
  min-height: 0;
  display: flex;
  align-items: flex-end;
`;

const Bar = styled.div<{ pct: number; color: string }>`
  width: 100%;
  height: ${({ pct }) => pct}%;
  background-color: ${({ color }) => color};
  border-radius: 2px 2px 0 0;
`;

const Label = styled.div`
  flex: 0 0 auto;
  padding-top: 4px;
  font-size: 11px;
  text-align: center;
  white-space: nowrap;
  overflow: hidden;
  text-overflow: ellipsis;
`;

export default function HelloChart({
  width,
  height,
  data,
  categoryColumn,
  metricLabel,
  threshold,
  highlightColor,
}: HelloChartProps) {
  const max = Math.max(1, ...data.map(row => Number(row[metricLabel]) || 0));

  return (
    <Wrapper width={width} height={height}>
      {data.map(row => {
        const value = Number(row[metricLabel]) || 0;
        const pct = (value / max) * 100;
        const hot = value >= threshold;
        const category = String(row[categoryColumn]);
        return (
          <Column key={category} title={`${category}: ${value}`}>
            <BarArea>
              <Bar pct={pct} color={hot ? highlightColor : '#ccc'} />
            </BarArea>
            <Label>{category}</Label>
          </Column>
        );
      })}
    </Wrapper>
  );
}

The nesting is worth a moment, because it is the part people get wrong first. A percentage height only resolves against a parent with a definite height. Wrapper gets one from the pixel height Superset hands it, and BarArea gets one from being a flex child of Wrapper, so height: ${pct}% on the bar works. Put that percentage directly inside an auto-height div and every bar collapses to nothing.

Otherwise this is plain HTML and CSS on purpose. It has no chart library dependency, it is trivially testable, and it demonstrates the two things every component must do: fill the width and height Superset gives it, and read its theme from @superset-ui/core rather than hard-coding fonts. For anything more demanding, look at how @superset-ui/plugin-chart-echarts wraps ECharts, or how the deck.gl plugins handle WebGL. The pattern is the same; only the drawing changes.

Step 3: Run it inside Superset

The plugin has to be part of the Superset frontend bundle. Superset does carry an experimental DYNAMIC_PLUGINS feature flag that fetches a plugin from a URL at runtime, but it has stayed experimental for years and nothing in the dashboard experience is built around it, so treat compiling into the bundle as the supported path.

The package’s entry point is its build output, not its source, so build it before linking:

bash
cd superset-plugin-chart-hello
npm i --force
npm run build

The --force is there because the generator’s peer dependency ranges rarely resolve cleanly against a single Superset checkout. Then link the package into the Superset frontend:

bash
cd ../superset/superset-frontend
npm i -S ../../superset-plugin-chart-hello

Then open src/visualizations/presets/MainPreset.js and add the plugin alongside the built-ins:

javascript
import HelloChartPlugin from 'superset-plugin-chart-hello';

// ... inside the plugins array passed to super()
new HelloChartPlugin().configure({ key: 'hello_chart' }),

The key is the chart’s viz_type. It is stored on every saved chart that uses the plugin, so choose it once and never change it.

Now run three processes: the backend, the Superset dev server, and a watch build for the plugin.

bash
# terminal 1, from the repo root with your virtualenv active
superset run -p 8088 --with-threads --reload --debugger

# terminal 2
cd superset/superset-frontend
npm run dev-server

# terminal 3, in the plugin directory
npm run dev

That third terminal is not optional. Superset resolves the linked package through its main field, which points at compiled output, so editing src/HelloChart.tsx changes nothing until the plugin is rebuilt. npm run dev is the generator’s watch build; check the scripts block in your package.json if the name differs. Without it you will edit code for twenty minutes and conclude that hot reloading is broken.

Open http://localhost:9000, create a chart, and search for “Hello Chart” in the picker. Pick a dataset, a category column and a metric, and you should see bars. Change the threshold and watch the bars recolour without a spinner, which confirms the render trigger is wired correctly.

If the dev server does not pick up a rebuilt plugin, restart it; watching across a symlink is occasionally flaky on Windows and in Docker volumes.

Step 4: Getting it into production

Because the plugin is compiled into the bundle, production means building Superset’s frontend with your plugin included. The official apache/superset image does not contain the frontend source, so you build from the repository at the tag you deploy:

  • In your Superset checkout, add the plugin dependency to superset-frontend/package.json and the registration line in MainPreset.js. Use a git URL or a private registry entry, not the relative path you developed against: the plugin directory sits outside the Docker build context, so a relative dependency fails at npm ci rather than merely being untidy. Commit both changes on a branch named for the Superset version, for example 4.1.1-acme.
  • Build the image from the repo root: docker build -t registry.example.com/superset:4.1.1-acme .. The Dockerfile’s frontend build stage runs npm ci and the frontend build, which now includes your plugin.
  • Deploy that image in place of the official one. Nothing else changes: same configuration, same metadata database, same Helm chart or compose file.

When you upgrade Superset, rebase the branch onto the new tag, bump the plugin’s @superset-ui/* peer dependencies to match, rebuild, and run the plugin’s tests. Budget half a day for a minor version and more for a major one; the ChartPlugin API is stable, but control-panel helpers and theme tokens do move.

Step 5: Tests worth writing

The generator sets up Jest. Three tests pay for themselves immediately:

  • transformProps with a realistic ChartProps fixture: assert the metric label resolution for both string and ad-hoc metrics, the camelCase control names, and the empty queriesData case.
  • buildQuery with sample form data: assert the query object contains the expected groupby and metrics, so a control rename does not silently produce an empty query.
  • The component with React Testing Library: render with three rows, assert three bars, and assert the highlighted count for a given threshold.

Superset’s frontend also has a Storybook (superset-frontend/storybook). Adding a story for your plugin gives designers and stakeholders a place to look at it without a running backend.

Pitfalls that cost time

  • Peer dependency drift. @superset-ui/core in your plugin must be the version the Superset frontend uses. Two copies of the library in one bundle produce baffling errors about themes or registries being undefined.
  • Forgetting the plugin’s watch build. The linked package serves compiled output, so source edits are invisible until it rebuilds.
  • camelCase vs snake_case. Controls are defined in snake_case and read in camelCase. Log formData once in transformProps if a value is missing.
  • Forgetting renderTrigger. Every cosmetic control without it forces a database round trip.
  • Declaring behaviours you have not implemented. Behavior.InteractiveChart without a setDataMask call gives users a cross-filter option that does nothing.
  • Percentage sizing inside auto-height containers. Give the parent a definite height or the chart renders empty at full data.
  • Hard-coded colours and fonts. Read them from the theme so the chart looks right in a themed or white-labelled Superset.
  • Changing the viz_type key. Saved charts reference it. Renaming it orphans every chart built on the plugin.
  • Ignoring width and height. Superset tells your component its size. A chart that sizes itself overflows dashboard grid cells.
  • Forking Superset core. Put chart logic in the plugin package, not in the Superset repo. The only lines you should be maintaining in the fork are the dependency and the registration.

What we have built this way

The mechanics above are the same ones behind the plugins we have written up on this blog: a dual-axis line chart for Superset 4 that plots two measures on independent axes and takes part in cross-filtering, and a multi-threshold heatmap for Superset 4.1 that colours cells against several hard limits instead of one gradient. Both started as exactly the skeleton in this post.

If you have a chart in mind and want to know what it would take, our Plugin Scoping Call is a free 45-minute session with a plugin engineer. You describe the visualisation, we walk through the data shape and interactions, and within 48 hours you get a written scope, effort estimate, and timeline you can act on with or without us. The wider service is described on our Superset plugin development page.

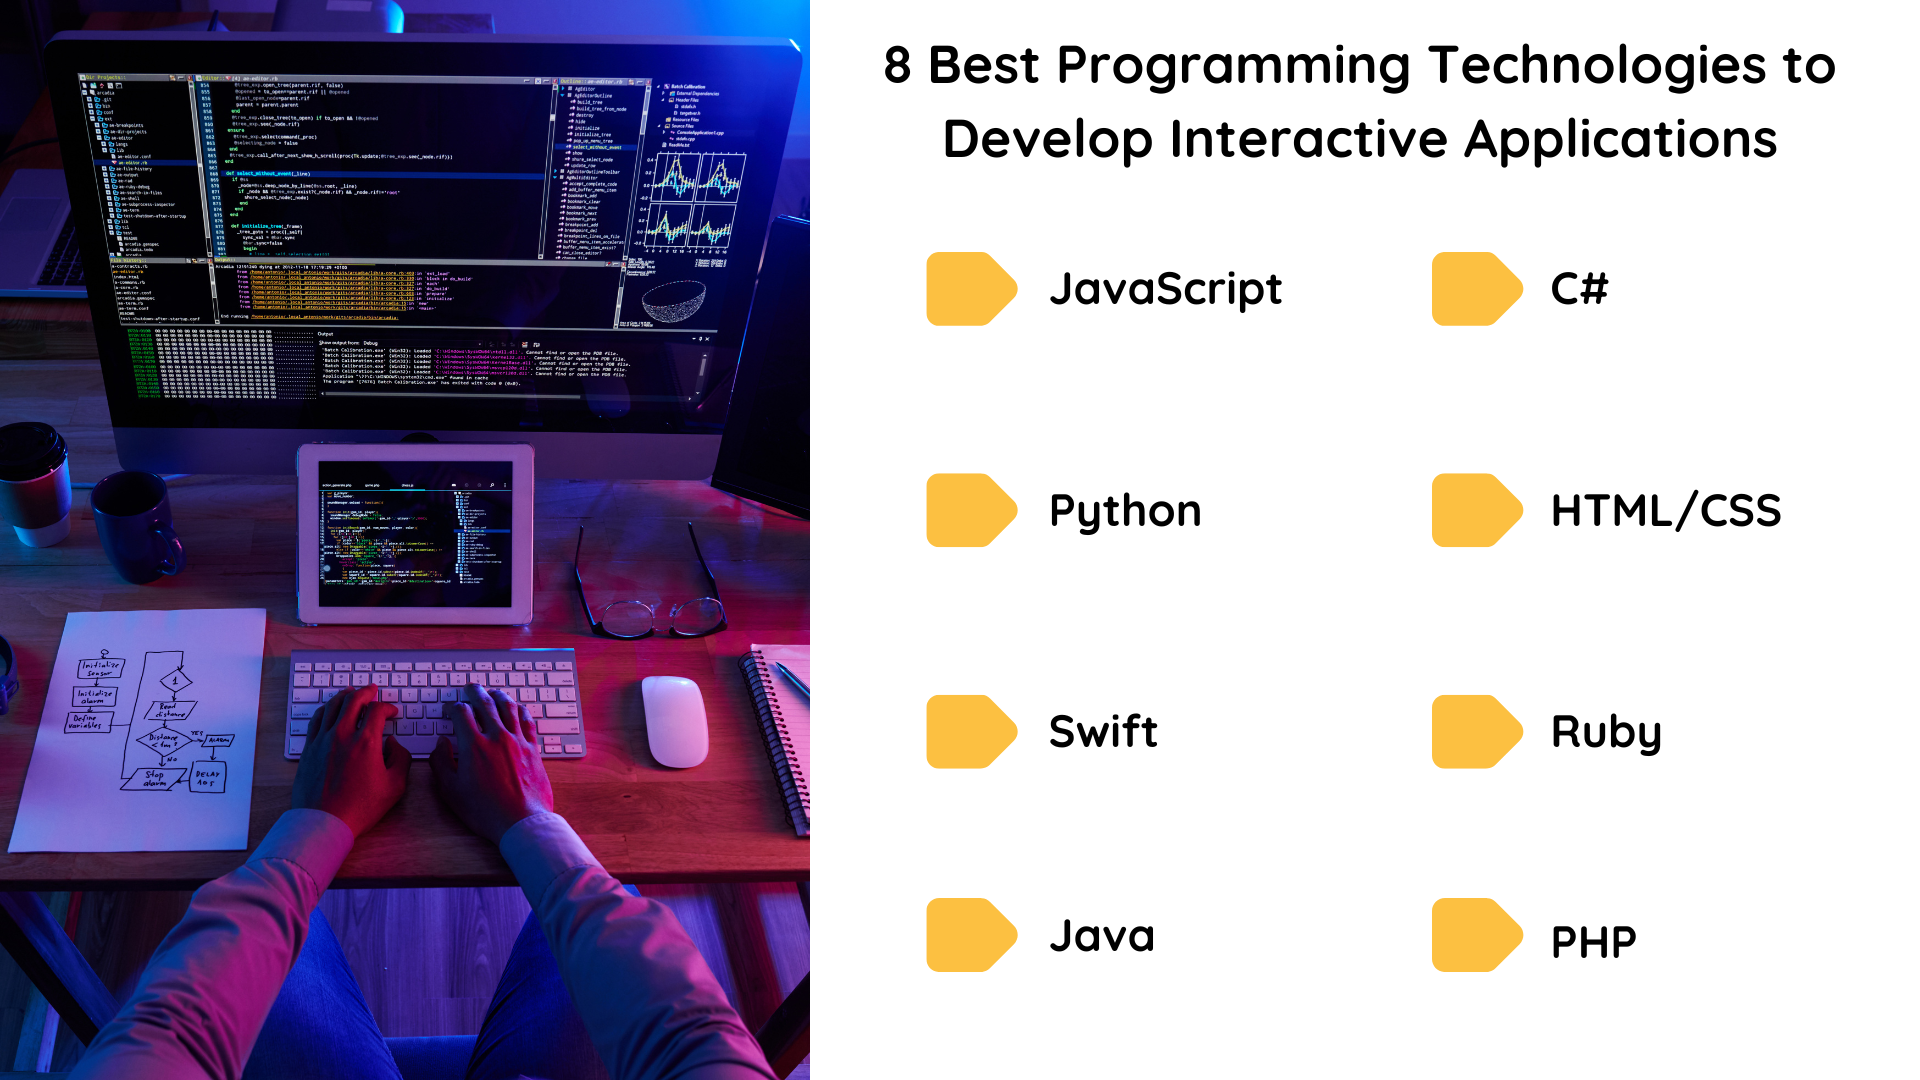
8 Best Programming Technologies to Develop Interactive Applications

In today’s digital age, programming technologies play a vital role in shaping our daily experiences, from mobile apps, websites to virtual reality (VR) and augmented reality (AR) and to develop interactive applications. Behind these innovations are powerful programming technologies that enable developers to create immersive and engaging user interfaces.

Let’s explore some of the top programming languages used to develop interactive technologies and understand. Why they are preferred choices for building dynamic and user-friendly applications.

1. JavaScript

JavaScript is undoubtedly one of the most widely used programming languages to develop interactive applications. 

With frameworks like React, Vue.js, and Angular, JavaScript allows developers to build rich and responsive user interfaces that dynamically update based on user actions. 

JavaScript’s versatility extends beyond web development, with frameworks like React Native enabling developers to create interactive mobile applications for both iOS and Android platforms.

2. Python

Python has gained popularity primarily to develop interactive applications, particularly in fields such as data visualization, scientific computing, and machine learning. 

Libraries like Pygame facilitate game development, while tools like Flask and Django enable the creation of interactive web applications. 

Python’s clear syntax and extensive libraries make it a preferred choice for prototyping and developing interactive prototypes quickly.

3. Swift

Swift is Apple’s programming language for developing interactive and immersive iOS applications. 

With its modern syntax and powerful features, Swift simplifies the process of building engaging user interfaces for iPhones, iPads, and Mac devices. 

Swift is well-suited to develop interactive applications that leverage device-specific features like touch gestures, animations, and augmented reality experiences using ARKit.

4. Java

Java remains a robust choice for developing interactive applications, especially for Android devices. 

Android Studio, powered by Java, offers a comprehensive toolkit for creating interactive mobile apps that leverage device sensors, touch input, and multimedia capabilities. 

Java’s cross-platform compatibility and extensive ecosystem of libraries make it a preferred language for developing interactive Android applications.

5. C#

C# is widely used for developing interactive applications, particularly in the realm of game development and virtual reality (VR) experiences. 

With the Unity game engine, developers can harness the power of C# to create immersive 2D and 3D games that engage users through captivating visuals and interactive gameplay. 

C# is also utilized for developing applications for Microsoft’s HoloLens and other mixed reality devices.

6. HTML/CSS

Although not traditional programming languages, HTML (HyperText Markup Language) and CSS (Cascading Style Sheets) are essential for building interactive websites and web applications. 

HTML provides the structure, while CSS handles the styling and layout of web elements. 

Together with JavaScript, HTML and CSS enable the creation of dynamic and interactive web experiences, including animations, transitions, and responsive designs.

7. Ruby

Ruby application development, known for its elegant syntax and developer-friendly design, is utilized to develop interactive applications through frameworks like Ruby on Rails. 

Rails, a powerful web framework built on top of Ruby, enables rapid development of feature-rich and interactive websites. 

Ruby’s focus on developer happiness and productivity makes it a popular choice for startups and small teams looking to build scalable and interactive web applications efficiently.

8. PHP

PHP application development is a server-side scripting language commonly used for developing dynamic and interactive websites. 

With frameworks like Laravel and Symfony, PHP empowers developers to create web applications with interactive features such as user authentication, real-time updates, and database interactions. 

PHP’s widespread adoption and extensive community support make it a versatile language for building interactive technologies on the web.

Conclusion

The programming languages mentioned above are just a few examples of the diverse tools available to developers which they implement to develop interactive applications. 

Whether you’re building a web application with dynamic user interfaces, a mobile app with engaging touch interactions, or a virtual reality experience with immersive visuals, choosing the right programming language is key to delivering a seamless and enjoyable user experience. 

By leveraging these languages and their respective frameworks, developers can unlock the full potential of interactive technologies and bring their creative visions to life in the digital world. If you want to build interactive websites then hire Andolasoft; we provide web and mobile app development services that not only meet but exceed expectations.

VueJS Application Development and Its Benefits

VueJS is a progressive JavaScript framework intended to help developers build user interfaces. It’s an open-source project that was launched in February 2014 and has since grown impressively fast.

With Vue, you can build highly interactive user interfaces that respond to user actions with extreme speed. Moreover, the framework is lightweight and offers an easy transition from other similar libraries like React or AngularJS.

VueJS is one of the best JavaScript frameworks to choose from among many other frameworks. Modern web applications will help you compete in a growing market by saving time, effort, and money as they require modern web solutions.

VueJS is very scalable, this means the application will perform well even if there are thousands of users and this also supports different devices and browsers. VueJS is also supported by big companies like Facebook, Netflix, and Google. So you don’t have to worry about any compatibility issues when using VueJS with these platforms.

It is the rapidly growing JavaScript framework that’s been around for several years and offers a number of benefits like lightweight, highly customizable, and many more.

Why VueJS Application Development

To develop a VueJS application, you need to download the VueJS library, create a root component, and write some HTML code. That’s all!

Never miss an update from us. Join 10,000+ marketers and leaders.

There’s no need to install any other tools or frameworks as all the necessary functionality will be provided by the Vue library itself. You can then add some styling to your application using CSS, or you can even choose to skip them if you want your application to be purely functional. Once you’ve done all, you can run your application and see it in the browser.

Vue is simple, flexible, and quick to learn. It can be used in both small and large-scale applications and can be integrated with other technologies and frameworks. Vue also has a large community of developers and a low barrier to entry, which means you will have no trouble finding help if you need it.

Vue is often compared to other popular alternatives like React or Angular. It is a lightweight solution that lets you build highly interactive web applications with less code. Versatility and approachability are the main qualities that make VueJS more popular. One can quickly start developing applications with VueJS if one knows HTML, CSS, and JavaScript and have a basic understanding.

Web Developers are also appreciating Vue because it gives insights and Vue CLI makes it easy to develop and manage complex projects. VueRouter and Vuex make it possible to create complex business logic and reactive UI that make it extremely flexible. Single page applications can be developed with this modern too and it also supports server-side rendering.

Simplicity, flexibility, and intuitive approach make it an excellent choice for both new and experienced developers. Vue also has a large and helpful community behind it and is backed by an established company.

Benefits of VueJS Application Development:

Let’s have a look at the benefits of VueJS,

1. Great Flexibility

VueJS is one of the highly flexible frameworks. Because it can be used for a wide range of purposes. It is a component-based architecture and each component can be customized to fit any application. Vue has been used for building desktop applications, web applications, and mobile applications and it is also used for building single-page applications (SPAs).

2. Easily Understandable

VueJS is a JavaScript framework used to build beautiful single-page web applications. The key concepts are straightforward and well-defined, so you can easily grasp how they work. VueJS makes it easy for developers to build highly interactive interfaces with intuitive drag-and-drop components. It also provides an easy-to-use API that enables you to connect your app easily with APIs using HTTP requests.

3. Model-View-View Model (MVVM) Architecture

VueJS Model-View-View Model Architecture is a frontend architecture pattern that divides the view into three distinct elements: models, templates, and views. The VueJS Model-View-View Model Architecture pattern is widely used in web applications where multiple components of the application need to be displayed on the page.

Are you looking for a VueJS application developer

Contact Us

4. Progressiveness

Progressive web apps are an emerging trend in the world of web design. One of the most important aspects of progressive web apps is to avoid unnecessary resource utilization. Progressiveness is a fundamental part of being able to grow and learn as a company or individual.

5. Community and Support

The VueJS community and support are very active. The best thing about the Vue.js community is, that is very welcoming and supportive. It has also a valuable resource for questions and advice as well as troubleshooting. VueJS has strong developer tools like a rich command line interface (CLI) with support for Typescript and other features like hot reloading and live to reload when your code changes.

6. Simple Integration

VueJS is a framework for building UI components in a declarative and efficient way. It’s also very easy to integrate with other frameworks, such as React. If you have a Vue component that needs to sync with the backend in some way, you can use Vuex to easily store and retrieve data. VueJS provides a declarative, intuitive way to build complex UIs. It’s easy to use and scales well for large applications with thousands of users.

7. Two-Way Communication

Two-way communication is a communication mechanism in which the sender and receiver can communicate with each other directly. A two-way communication system could be used for a user to send a message to a server in order to request help or information. VueJS has great support for both reactive forms and custom events, so you don’t have to worry about adding extra code if you need to support the features.

I’ve worked with the team at Andolasoft on multiple websites. They are professional, responsive, & easy to work with. I’ve had great experiences & would recommend their services to anyone.

Ruthie Miller, Sr. Mktg. Specialist

Salesforce, Houston, Texas

LEARN MORE

Conclusion

VueJS is a progressive JavaScript framework that lets you build user interfaces. It is simple, flexible, and quick to learn. Vue has a large community of developers behind it and is backed by an established company. If you’re still not sure whether Vue is right for you, consider the above benefits that can provide for your business.

VueJS has great performance, easy to learn, flexible, lightweight, and scales well. I hope this article will help you in understanding the concept of VueJS application development and its benefits. If you are looking to hire a VueJS developer or VueJS application development company, make sure to do some research and choose wisely the best among all. Still, if you have confused about VueJS, then please schedule a call for free consultations with our experts.